Elliott Wave Technical Analysis: PayPal Holdings Inc. - Thursday, Aug. 3
Image Source: Unsplash
PayPal Holdings Inc., Elliott Wave Technical Analysis
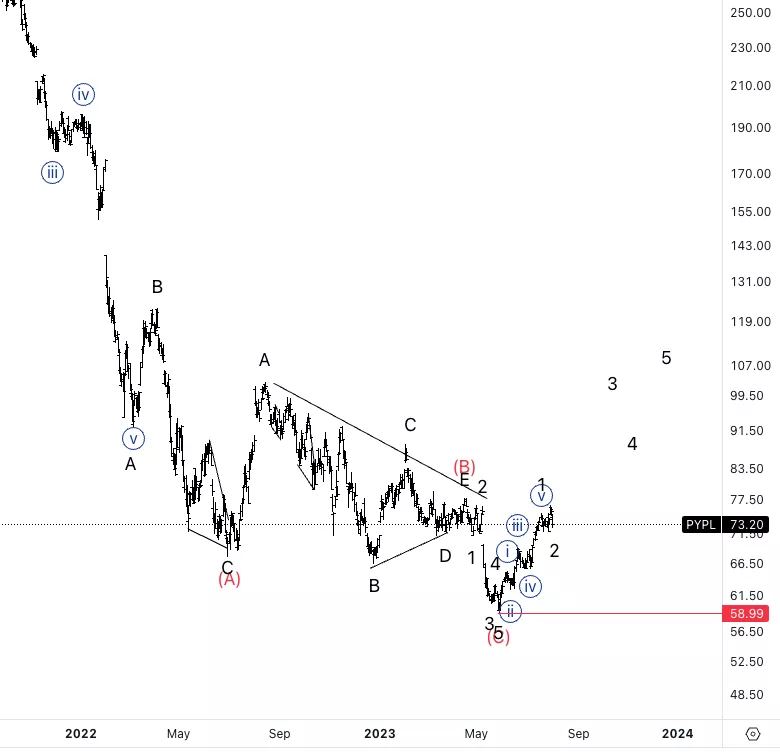
PayPal Holdings Inc., (Nasdaq: PYPL): Daily Chart 3 August 2023
PYPL Stock Market Analysis: We have been looking for a potential bottom at 58$ for a while and we successfully pullbacked from there. At this point we are looking for confirmation of at least a three wave pullback to the upside, if not the resumption of the overall bullish trend.
PYPL Elliott Wave Count: Wave 2 of (1) or (A).
PYPL Technical Indicators: Between 20 and 200EMA.
PYPL Trading Strategy: Looking for longs on the way up into wave 3.s
Analyst: Alessio Barretta

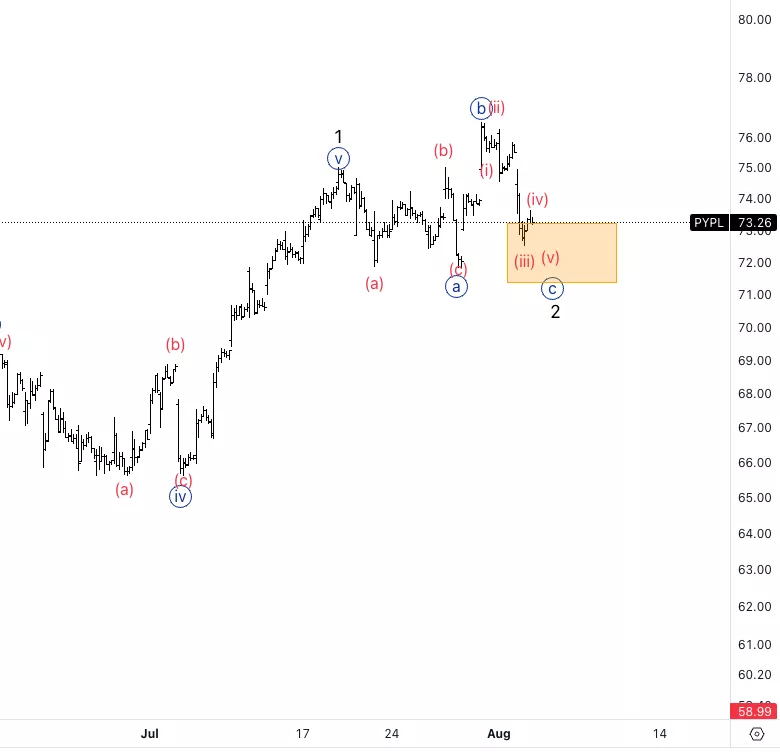
PayPal Holdings Inc., PYPL: 1-hour Chart, 3 August 2023
PayPal Holdings Inc., Elliott Wave Technical Analysis
PYPL Stock Market Analysis: Looking for an expanded flat in wave 2 which signifies strength of the uptrend, therefore we could expect a shallow wave 2 ending soon as we already met equality of {c}vs. {a}.
PYPL Elliott Wave count: Wave {c} of 2.
PYPL Technical Indicators: Above 200EMA.
PYPL Trading Strategy: Looking for longs into wave 3.

More By This Author:
Elliott Wave Technical Analysis: Bitcoin/U.S. Dollar - Thursday, Aug. 3
Elliott Wave: Analyzing AAPL, TSLA, AMZN, NVDA, MSFT, Meta, NFLX, GOOGL
Elliott Wave Technical Analysis: Uniswap/U.S. Dollar - Wednesday, August 2
Analyst Peter Mathers TradingLounge™ Australian Financial Services Licence - AFSL 317817


