Elliott Wave Technical Analysis - Palo Alto Networks Inc.
PANW Elliott Wave Analysis Trading Lounge
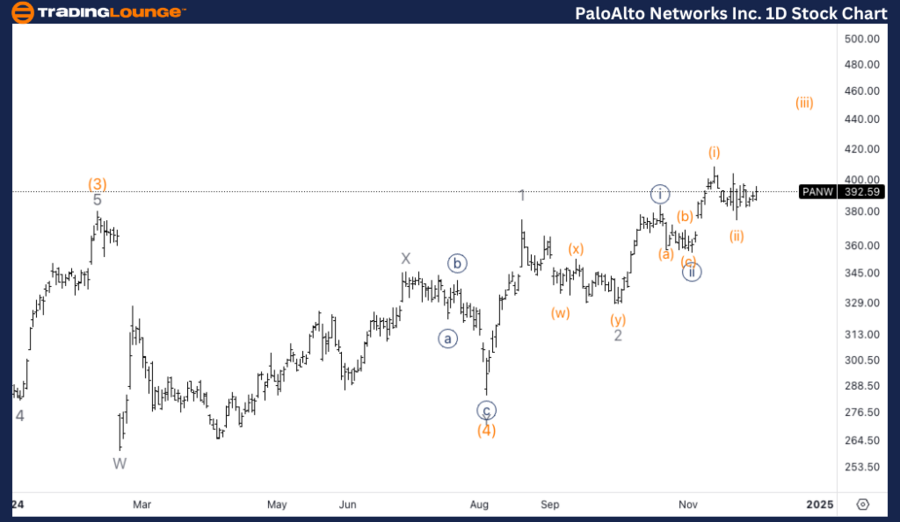
Palo Alto Networks Inc., (PANW) Daily Chart
PANW Elliott Wave Technical Analysis
FUNCTION: Trend
MODE: Impulsive
STRUCTURE: Motive
POSITION: Minute {iii}.
DIRECTION: Upside within {iii} of 3.
DETAILS: Looking for further upside into wave (5) as we seem to have completed a large wave 2 and then started to nest in what could be a series of ones and twos.
Palo Alto Networks Inc., (PANW) 1H Chart
PANW Elliott Wave Technical Analysis
FUNCTION: Trend
MODE: Impulsive
STRUCTURE: Motive
POSITION: Wave {iv} of 3.
DIRECTION: Upside in wave {v}.
DETAILS: Here’s an alternate highlighting the possibility we are in a triangle in wave {iv}, and we are headed higher into wave {v} of 3 which has to be shorter than wave {iii}, therefore no higher than 444$.
This analysis focuses on the current trend structure of Palo Alto Networks Inc., (PANW) utilizing the Elliott Wave Theory on both the daily and 1-hour charts. Below is a breakdown of the stock's position and potential future movements.
* PANW Elliott Wave Technical Analysis – Daily Chart*
PANW is currently in Minute wave {iii} of an impulsive wave 3, with expectations for continued upside movement. After completing a large wave 2, the stock seems to have nested within a series of ones and twos in the early stages of wave 3. This suggests that a strong move to the upside is anticipated, as wave (5) is yet to unfold. Further gains are likely as the impulsive structure develops, confirming the bullish trend.
* PANW Elliott Wave Technical Analysis – 1H Chart*
On the 1-hour chart, PANW appears to be in wave {iv} of 3. An alternate scenario suggests that wave {iv} is forming a triangle, which would imply a consolidation period before the final leg up in wave {v} of 3. Since wave {v} must be shorter than wave {iii} (to maintain proportionality within the Elliott Wave framework), the upside target for wave {v} is capped at $444.
Technical Analyst : Alessio Barretta
More By This Author:
Unlocking ASX Trading Success: V300AEQ ETF Units - Wednesday, Dec. 4
Elliott Wave Technical Analysis: Australian Dollar/U.S. Dollar - Wednesday, Dec. 4
Elliott Wave Technical Analysis: Vechain Crypto Price News For Wednesday, December 4
Analyst Peter Mathers TradingLounge™ Australian Financial Services Licence - AFSL 317817


.thumb.png.094e54e71e69dcae531928883c84857e.png)


