Elliott Wave Technical Analysis: Netflix Inc. - Tuesday, Feb. 18
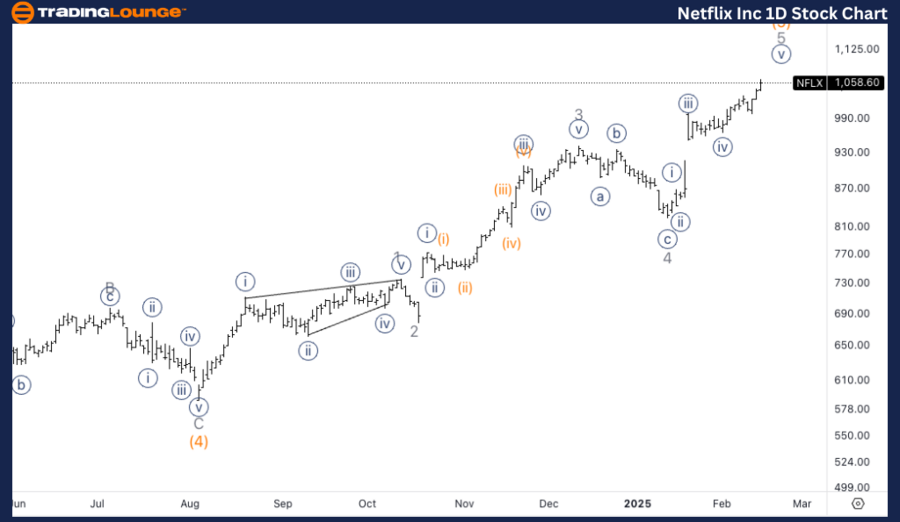
Netflix Inc. (NFLX) Daily Chart
NFLX Elliott Wave Technical Analysis
- Function: Trend
- Mode: Impulsive
- Structure: Motive
- Position: Wave {v} of 5
- Direction: Upside in wave 5
Details:
The stock is expected to continue higher beyond TradingLevel1 at $1000. The absence of significant resistance upon surpassing this level indicates strong bullish momentum. If wave {v} completes, a pullback to $1000 may occur before resuming the larger uptrend.
Netflix Inc. (NFLX) 1-Hour Chart
NFLX Elliott Wave Technical Analysis
- Function: Trend
- Mode: Impulsive
- Structure: Motive
- Position: Wave (iii) of {v}
- Direction: Upside in wave {v}
Details:
Further upside is anticipated into an extended wave {v}. The next target for the rally could be around $1200.
NFLX Elliott Wave Summary
This Elliott Wave analysis reviews Netflix Inc. (NFLX) across both the daily and 1-hour charts to determine current wave positioning and potential price action.
Daily Chart Summary:
Netflix is in wave {v} of 5, maintaining an impulsive upward structure. The stock recently broke past TradingLevel1 at $1000 without notable resistance, reinforcing the bullish momentum. As wave {v} progresses, further gains are expected, though a temporary pullback to $1000 could follow.
1-Hour Chart Summary:
The stock is extending within wave (iii) of {v}, supporting further upward movement. The short-term outlook suggests a target of $1200 before wave {v} concludes, driven by strong market momentum.
Technical Analyst: Alessio Barretta
More By This Author:
Elliott Wave Technical Analysis: ASX Limited - Tuesday, Feb. 18
Elliott Wave Technical Analysis: Euro/British Pound - Tuesday, Feb. 18
Elliott Wave Technical Analysis: Shanghai Composite Index - Tuesday, Feb. 18
At TradingLounge™, we provide actionable Elliott Wave analysis across over 200 markets. Access live chat rooms, advanced AI & algorithmic charting tools, and curated trade ...
more

.thumb.png.70b81de9500494d9f28534b939b9dd00.png)


