

Image Source: Unsplash
Netflix Inc., Elliott Wave Technical Analysis
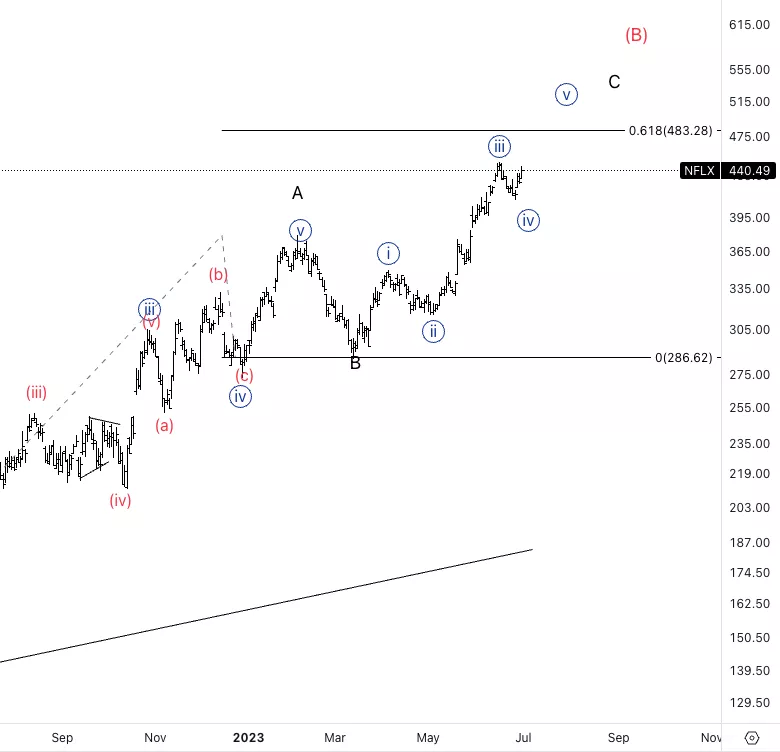
Netflix Inc., (Nasdaq: NFLX): Daily Chart, 3 July 2023.
NFLX Stock Market Analysis: We have been looking at a completion of this large upmove into a wave C. It looks like we could be near the end as we start to approach 61.8% C vs. A. There is also a possibility wave B end where current wave {ii} is.
NFLX Elliott Wave Count: Wave {iv} of C.
NFLX Technical Indicators: Above all averages.
NFLX Trading Strategy: Looking for another leg higher into wave {v}.
Analyst: Alessio Barretta
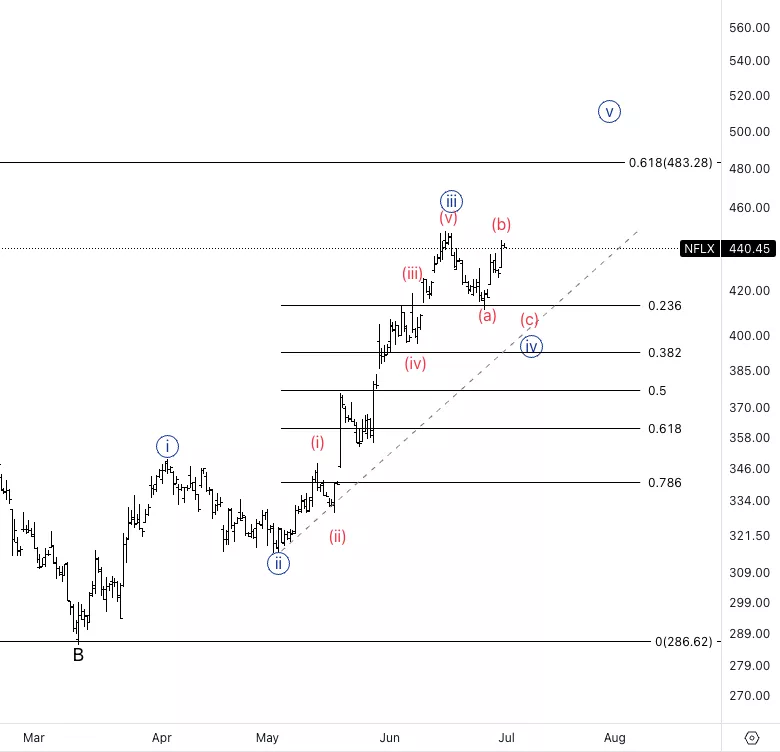
Netflix Inc., NFLX: 4-hour Chart, 3 July 2023.
Netflix Inc., Elliott Wave Technical Analysis
NFLX Stock Market Analysis: Looking for another leg lower into wave (c) of {iv} to potentially reach the 38.2% of wave {iii}.
NFLX Elliott Wave count: Wave (b) of {iv}
NFLX Technical Indicators: Above all averages.
NFLX Trading Strategy: Looking for longs once we get a leg lower into wave (c).
More By This Author:
Elliott Wave Technical Analysis: Polkadot/U.S.Dollar
Elliott Wave Technical Analysis: Global Stock Markets
Elliott Wave Technical Analysis: Intercontinental Exchange Inc. - Friday, June 30


Comments
Log in or sign up to join the conversation.