
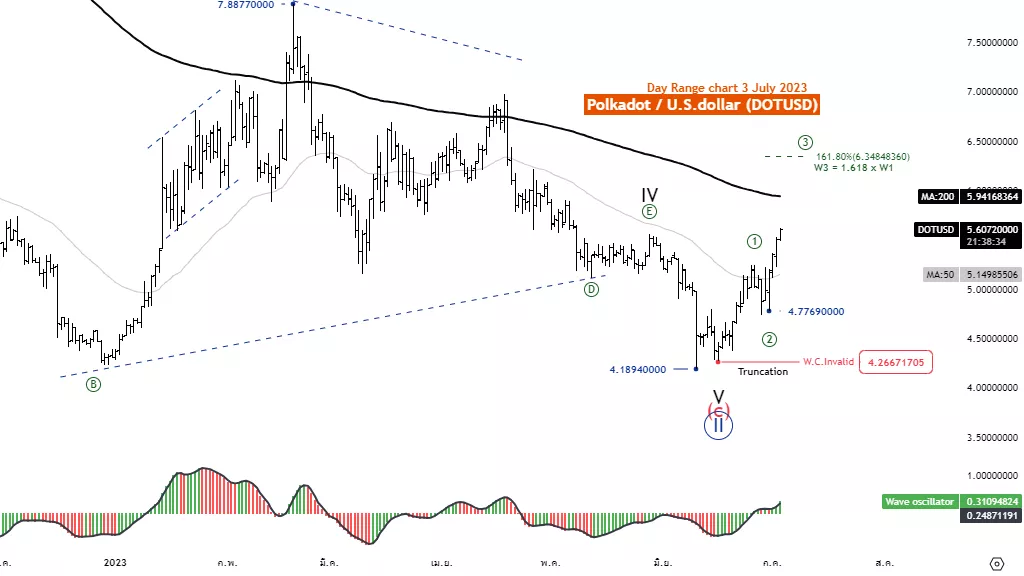
DOTUSD Daily Chart, July 3
Function: Follow Trend
Mode: Motive
Structure: Impulse
Position: Wave ((3))
Direction Next higher Degrees: wave I of Motive
Details: Wave 3 is equal to 1.618 x Wave 1 at 6.34
Wave Cancel invalid level: 4.26
DOTUSD Trading Strategy: Polkadot recovered well from the 4.266 level and was able to form a strong five-wave structure, giving Chainlink the opportunity to form a new uptrend. But even so, the price is still below the MA200 line, giving the price a chance to face selling pressure. So watch out for resistance at the MA200 line.
DOTUSD Technical Indicators: The price is below the MA200 indicating a downtrend, Wave Oscillator are bullish momentum.
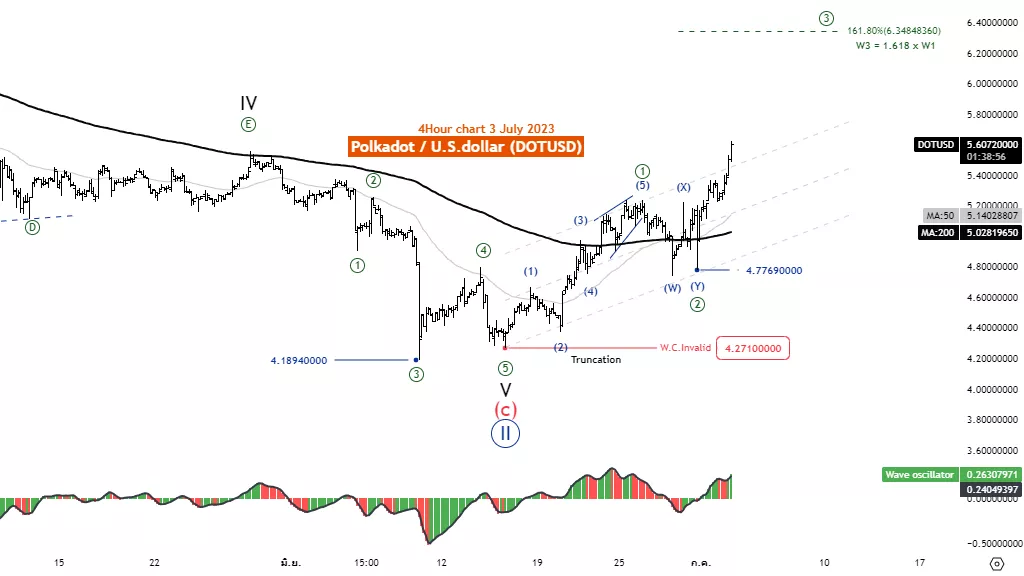
DOTUSD July 3rd 4H Chart
Function: Follow Trend
Mode: Motive
Structure: Impulse
Position: Wave ((3))
Direction Next higher Degrees: wave I of Motive
Details: Wave 3 is equal to 1.618 x Wave 1 at 6.34
Wave Cancel invalid level: 4.26
DOTUSD Trading Strategy: Polkadot recovered well from the 4.266 level and was able to form a strong five-wave structure, giving Chainlink the opportunity to form a new uptrend. And the price tends to continue to rise. from movement in waves ((3)).
Polkadot/U.S.dollar(DOTUSD)Technical Indicators: The price is above the MA200 indicating an uptrend, Wave Oscillator are bullish momentum.
More By This Author:
Elliott Wave Technical Analysis: Global Stock Markets
Elliott Wave Technical Analysis: Intercontinental Exchange Inc. - Friday, June 30
Elliott Wave Technical Analysis: Dogecoin/U.S. Dollar - Friday, June 30


Comments
Log in or sign up to join the conversation.