
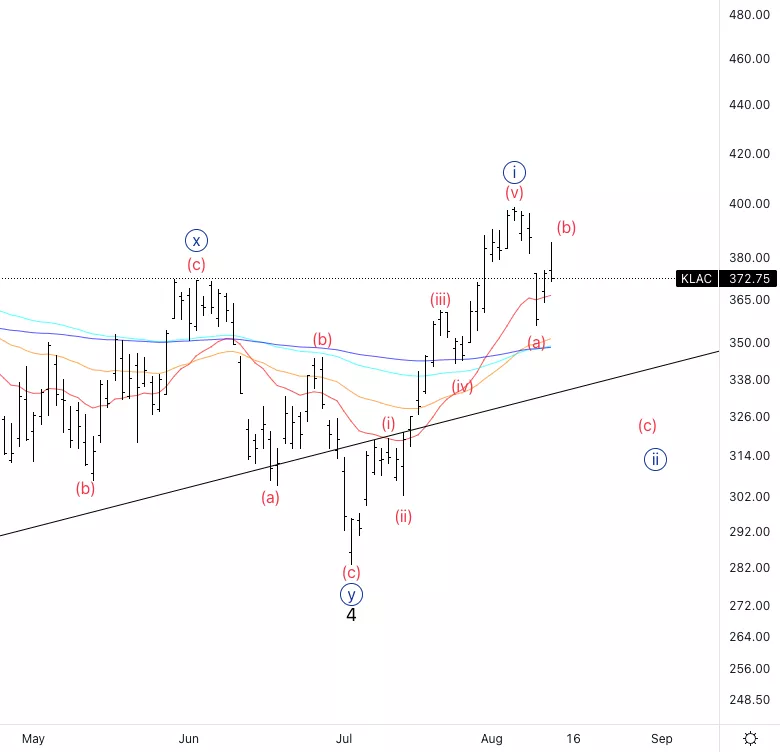
KLA Corp.,(Nasdaq: KLAC): Daily Chart, August 12, 2022,
KLACStock Market Analysis: Looking for a further continuation lower into wave c) of {ii}. Wave (b) may not be finished, however, I am still looking for a further downside after the initial move up we had in a five-wave manner.
KLAC Elliott Wave count: Wave c) of {ii}.
KLACTrading Strategy: Wait for the end of wave {ii} to start building long positions to target ATH.
KLAC Technical Indicators: We are above all EMAs which suggests we have resumed the uptrend. We could find support off the 200 EMA.
Analyst: Alessio Barretta
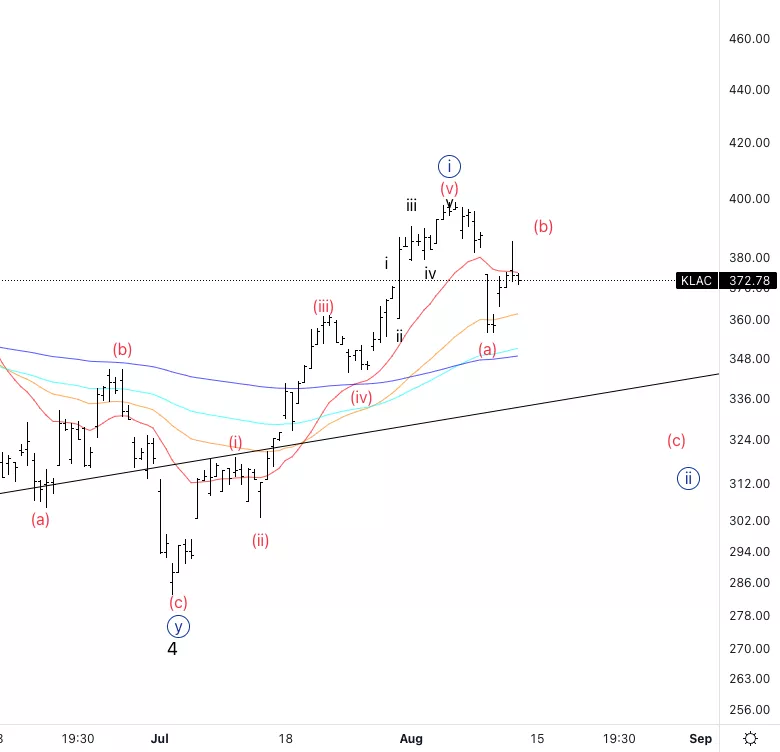
KLA Corp., KLAC: 4-hour Chart, August 12, 2022,
KLA Corp., Elliott Wave Technical Analysis
KLAC Stock Market Analysis: Looking for completion of wave (b) to the resume downside into wave c) which could even be traded on short timeframes.
KLACElliott Wave count: Wave c of (b).
KLAC Technical Indicators: We are facing resistance off the 20 EMA which could be a sign that wave (b) is completed or nearly completed.
KLACTrading Strategy: You could either look for shorts into wave c) or/and wait for a larger swing once wave {ii} is finished and target the upside with wave {iii}.
More By This Author:
Commodity Markets: Gold, Silver, DXY, Iron Ore, Crude Oil, Copper, Natural Gas
U.S. Stocks Market Elliott Wave Analysis - Risk On
Elliott Wave Technical Analysis: PayPal Holdings Inc.


Comments
Log in or sign up to join the conversation.