
Intuit Inc., Elliott Wave Technical Analysis
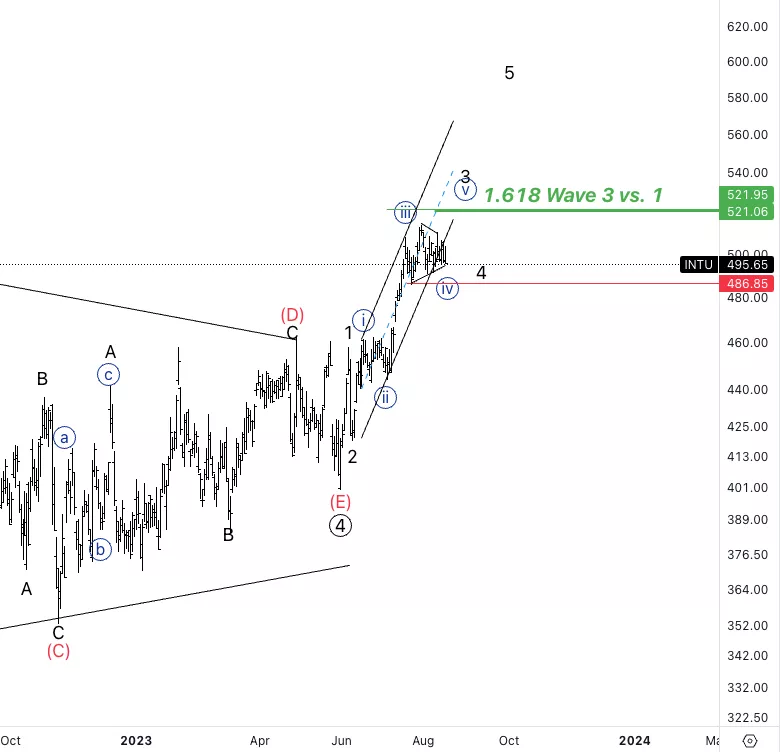
Intuit Inc., (INTU): Daily Chart, 17 August 23
INTU Stock Market Analysis: The count is suggesting the completion of a large degree wave 4 with the 400$ bottom, from which we are looking for additional upside.
Upside target for wave 3 stands at 521$.
INTU Elliott Wave Count: Wave {iv} of 3.
INTU Technical Indicators: Above all averages,20EMa as support.
INTU Trading Strategy: Looking for longs in wave 3 to then look for additional downside into 4.
(Click on image to enlarge)
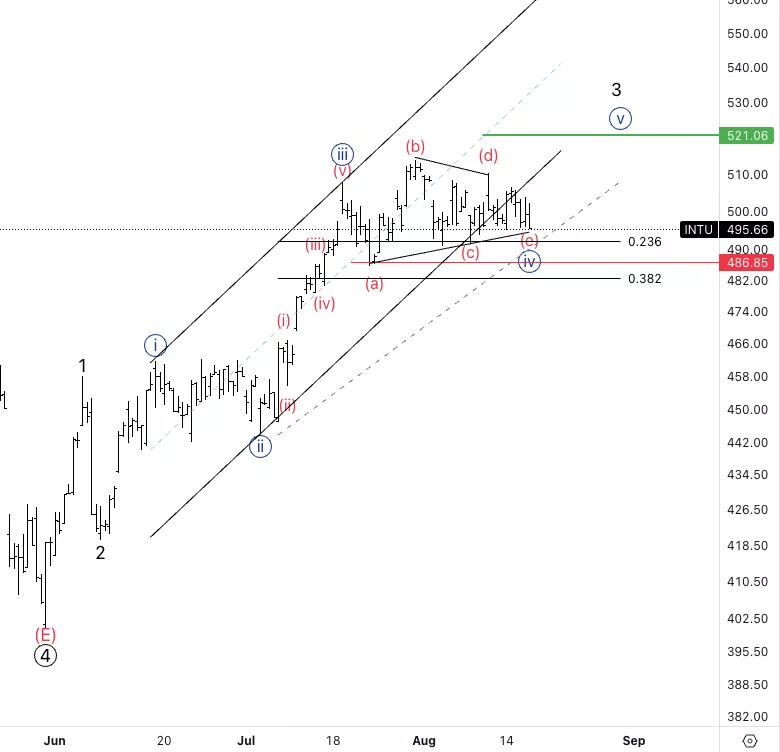
Intuit Inc., INTU: 4-hour Chart 17 August 23
Intuit Inc., Elliott Wave Technical Analysis
INTU Stock Market Analysis: Looking for a triangle in wave {iv} to be near completion. Invalidation level stands at 486.8$, we are finding support on the 23.6% retracement of wave [iii}.
INTU Elliott Wave count: Wave (e) of {iv}
INTU Technical Indicators: In between averages
INTU Trading Strategy: Looking longs into wave {v} with invalidation at 486$.
(Click on image to enlarge)
More By This Author:
Elliott Wave Technical Analysis Day Chart: U.S. Dollar/New Zealand Dollar
Elliott Wave Technical Analysis 4 Hour Chart: U.S. Dollar/New Zealand Dollar
Elliott Wave Technical Analysis: Bitcoin/U.S. Dollar - Thursday, Aug. 17


Comments
Log in or sign up to join the conversation.