

Image Source: Unsplash
Honeywell Internationall Inc., Elliott Wave Technical Analysis
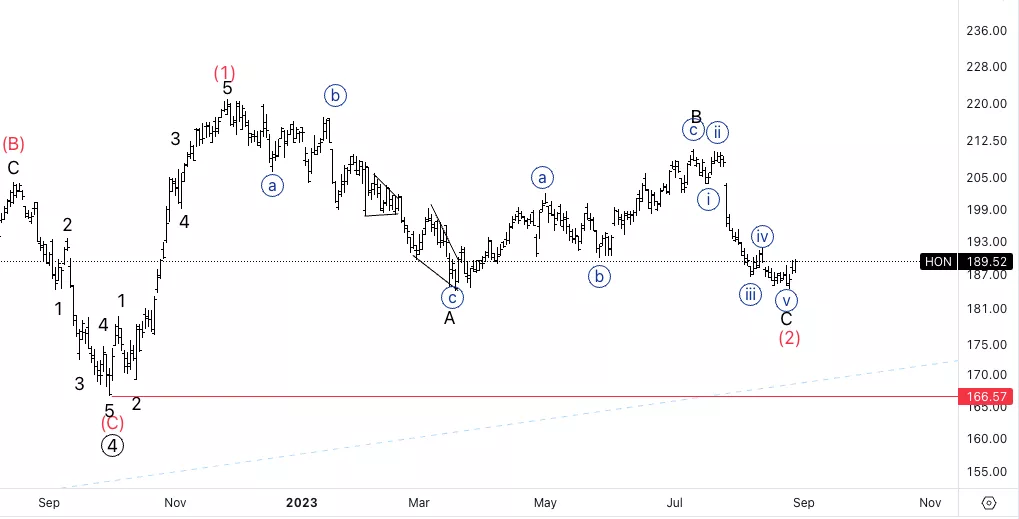
Honeywell Internationall Inc., (Nasdaq: HON): Daily Chart 30 August 2023
HON Stock Market Analysis: Looking for a potential (1)-(2) to then resume the overall uptrend. There is also a possibility this is an (A)-(B) and the upcoming upmove could just be the end of a larger three wave move to then resume lower and complete a primary degree wave 4.
HON Elliott Wave Count: Wave (2) of 1.
HON Technical Indicators: 20EMA as resistance.
HON Trading Strategy: Looking for longs after upside confirmation.
Analyst: Alessio Barretta
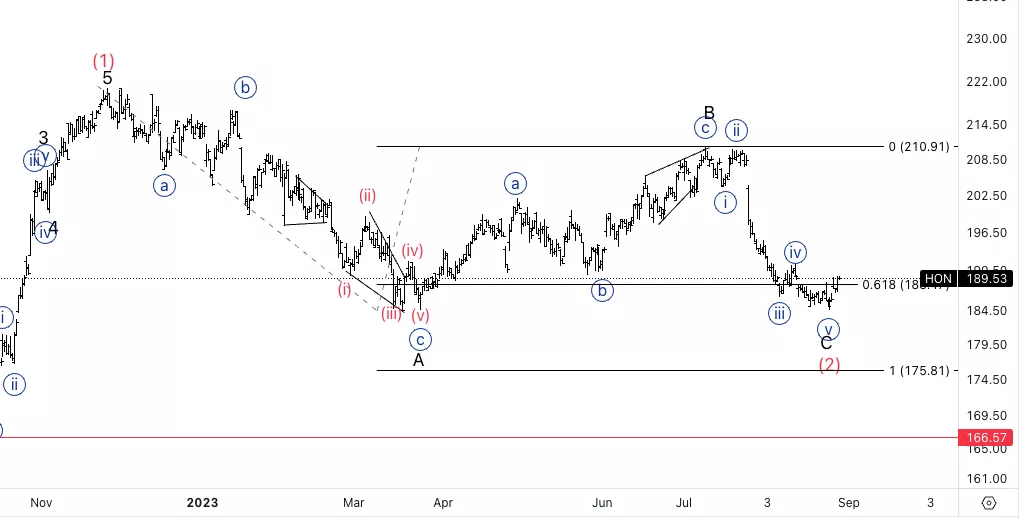
Honeywell Internationall Inc., HON: 4-hour Chart 30 August 2023
Honeywell Internationall Inc., Elliott Wave Technical Analysis
HON Stock Market Analysis: There is a possibility the downmove into wave C is completed as we can identify a five wave move to the downside. We seem to be finding support on the 0.618 C vs. A.
HON Elliott Wave count: Wave C of (2).
HON Technical Indicators: Between 20 and 200EMA.
HON Trading Strategy: Looking for longs into wave 1 of (3).
More By This Author:
Major World Indices - Elliott Wave Analysis
Elliott Wave Technical Analysis: United Parcel Service Inc. - Tuesday, Aug. 29
Elliott Wave Technical Analysis Day Chart: Australian Dollar/U.S. Dollar


Comments
Log in or sign up to join the conversation.