

Image Source: Pixabay
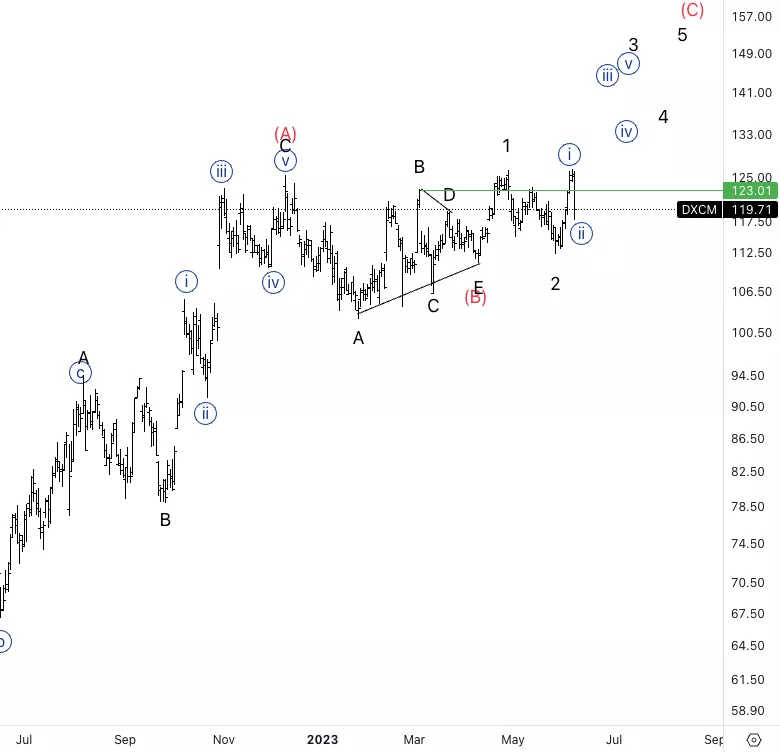
DexCom Inc., Elliott Wave Technical Analysis
DexCom Inc., (Nasdaq: DXCM): Daily Chart, 8 June 2023.
DXCM Stock Market Analysis: Moving as expected, we had a sharp move to the downside into what could be wave {ii}, I am expecting the bottom at around 110$ to hold as we continue higher.
DXCM Elliott Wave Count: Wave {i} of 3.
DXCM Technical Indicators: Above all averages.
DXCM Trading Strategy: Looking for upside continuation into wave 3.
TradingLounge Analyst: Alessio Barretta
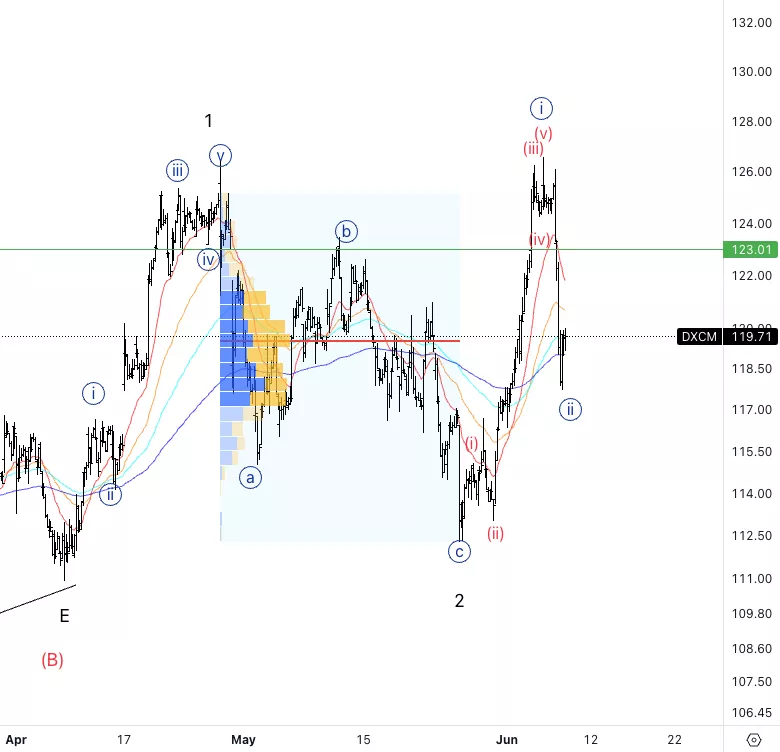
DexCom Inc., DXCM: 1-hour Chart, 8 June 2023.
DexCom Inc., Elliott Wave Technical Analysis
DXCM Stock Market Analysis: It looks like we have a potential five wave move into wave (i) and so far three wave down into wave {ii}. Looking for upside soon.
DXCM Elliott Wave count: Wave (c) of {ii}.
DXCM Technical Indicators: Above all averages.
DXCM Trading Strategy: Looking for a break of wave {i} to confirm upside resumption.
More By This Author:
Elliott Wave Technical Analysis: TRON/U.S. Dollar
Elliott Wave Technical Analysis: Spotify, Wednesday, June 7
Elliott Wave Technical Analysis: Bitcoin, June 7


Comments
Log in or sign up to join the conversation.