
Spotify Inc., Elliott Wave Technical Analysis

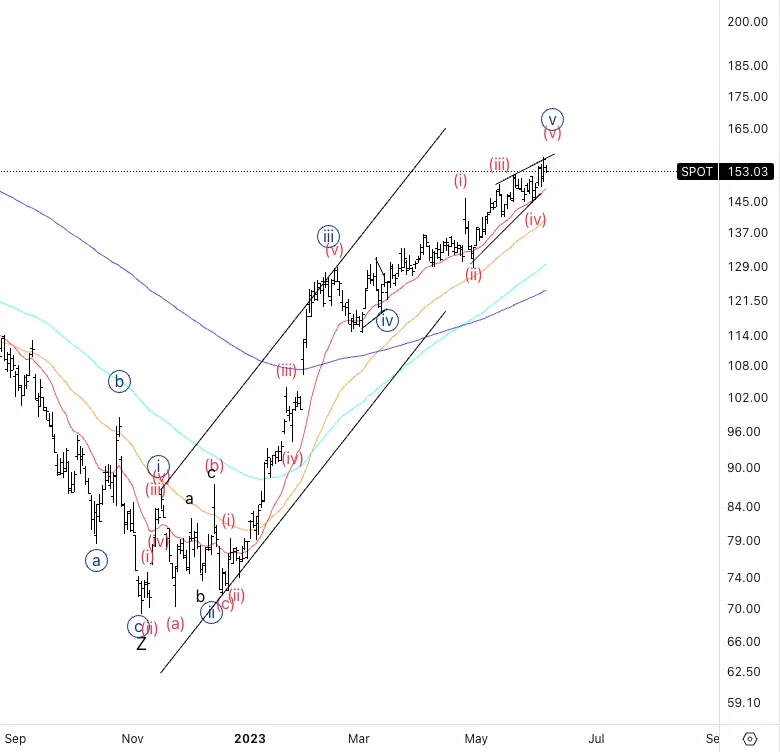
Spotify Inc., (SPOT): Daily Chart, Wednesday, June 7
SPOT Stock Market Analysis: We have witnessed an outstanding up move in Spotify as we rallied over 100% from the bottom at around $70. We are looking for a potential top soon as we seem to be having different reasons to believe so.
SPOT Elliott Wave Count: Wave (v) of {v}.
SPOT Technical Indicators: Above all averages.
SPOT Trading Strategy: Looking for a down move to begin the correction soon.
TradingLounge Analyst: Alessio Barretta
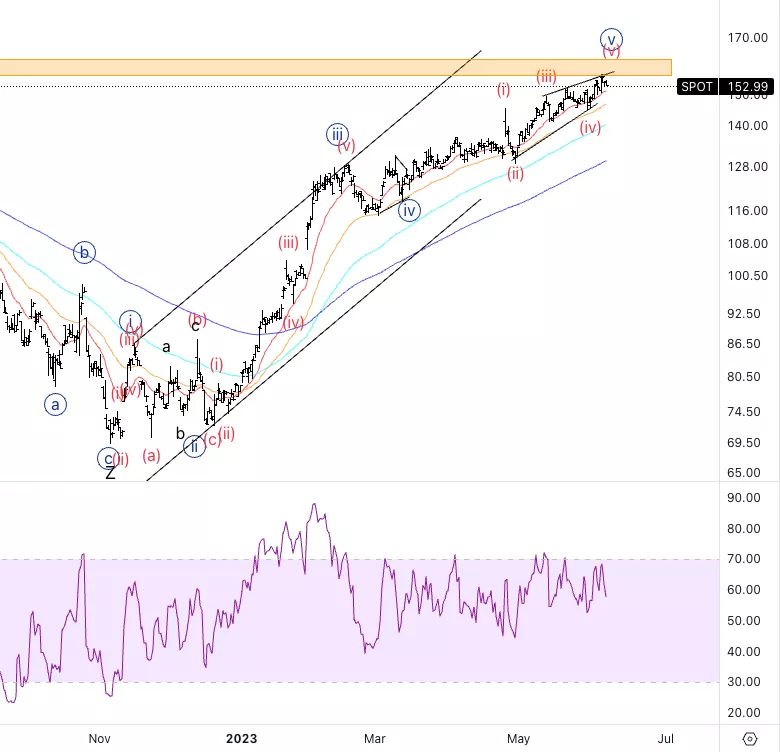
Spotify Inc., SPOT: 4-hour Chart, Wednesday, June 7
Spotify Inc., Elliott Wave Technical Analysis
SPOT Stock Market Analysis: As you can see we are looking at a potential ending diagonal in wave {v} as we encounter resistance which is visible on the daily chart and I highlighted the area in yellow. We have RSI bearish divergence suggesting we could be due a pullback.
SPOT Elliott Wave count: Wave (v) of {v}.
SPOT Technical Indicators: Above all averages.
SPOT Trading Strategy: Looking for a sudden drop to confirm the end of the uptrend.
More By This Author:
Elliott Wave Technical Analysis: Bitcoin, June 6
Tech Stocks - Elliott Wave Technical Analysis
Elliott Wave Technical Analysis: Ripple, June 5


Comments
Log in or sign up to join the conversation.