

Cisco Systems Inc., Elliott Wave Technical Analysis

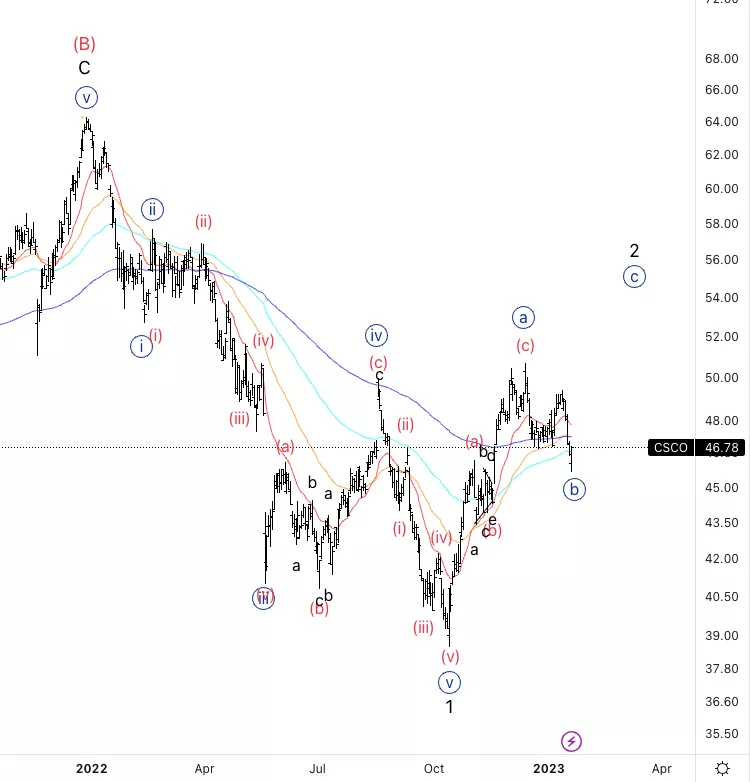
Cisco Systems Inc., (CSCO): Daily Chart, Jan. 23
CSCO Stock Market Analysis: Looking for further upside into wave {c} of 2 after a three wave mve in wave {b} as well as a three wave move in wave {a}(flat correction).
CSCO Elliott Wave Count: Wave {b} of 2.
CSCO Technical Indicators: At the cross of the averages.
CSCO Trading Strategy: Looking for a break of wave (b) of {b} to start looking for longs.
TradingLounge Analyst: Alessio Barretta
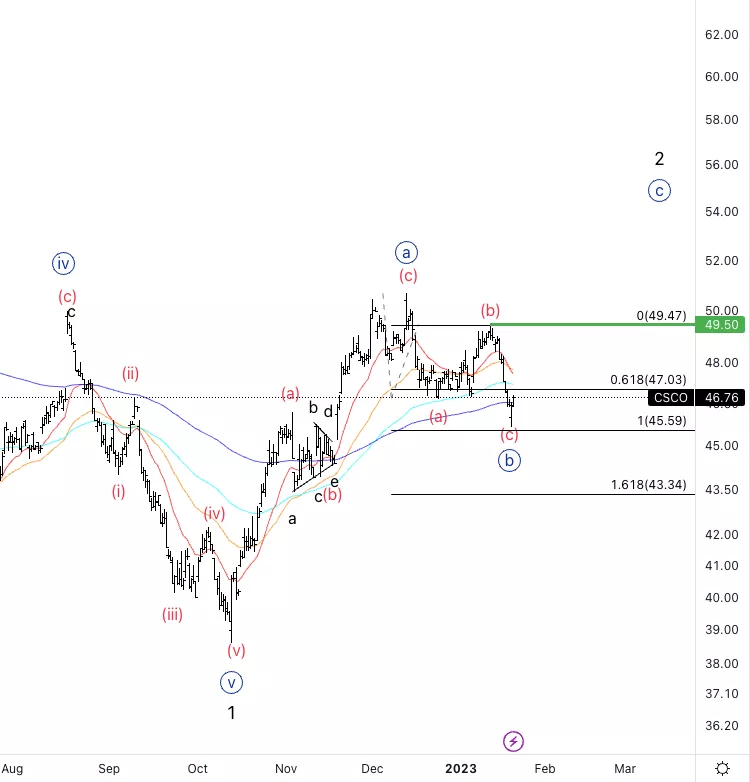
Cisco Systems Inc., CSCO: 4-hour Chart, Jan. 23
Cisco Systems Inc., Elliott Wave Technical Analysis
CSCO Stock Market Analysis: It looks like wave (c) could already be completed as it is finding support on the 200EMA, as well as on the 38.2% of wave {a} and it is very close to equality of (a) vs. (c).
CSCO Elliott Wave count: Wave (c) of {b}.
CSCO Technical Indicators: 200EMA acting as support.
CSCO Trading Strategy: Waiting for a break of green line for further confirmation.
More By This Author:
Stay Ahead In Commodities: Analysis & Trading Strategies For Futures Trading
Elliott Wave Technical Analysis: Honeywell Inc.
NEO Coin U.S.dollar(NEOUSD) Elliott Wave Technical Analysis 20 January 23



Comments
Log in or sign up to join the conversation.