Elliott Wave Technical Analysis: Berkshire Hathaway Inc. - Friday, Feb. 28
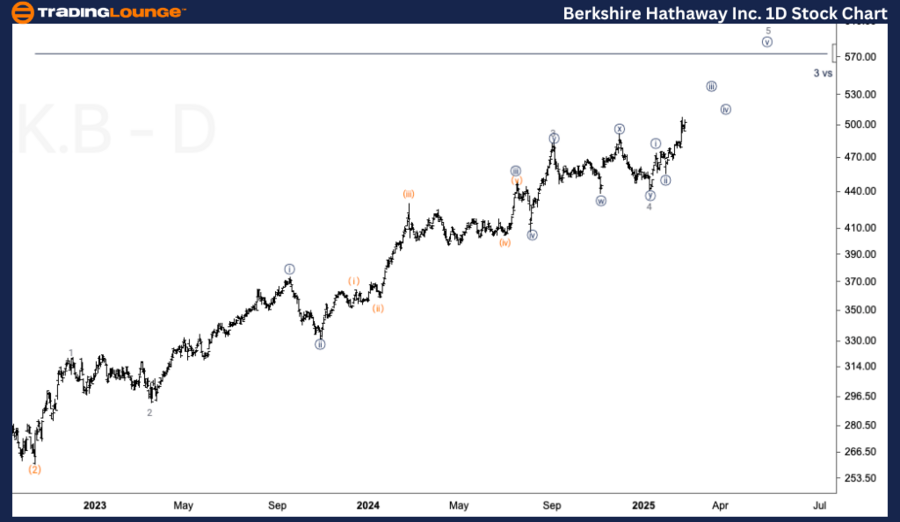
Berkshire Hathaway Inc. (BRK-B) Elliott Wave Analysis – Daily Chart
- Function: Trend
- Mode: Impulsive
- Structure: Motive
- Position: Wave 5 of (3)
- Direction: Upside into wave 5
Details:
- Expecting upside continuation into wave 5, with targets around $570.
- Key support above $500 is needed to confirm the bullish momentum.
Berkshire Hathaway Inc. (BRK-B) Elliott Wave Analysis – 1H Chart
- Function: Trend
- Mode: Impulsive
- Structure: Motive
- Position: Wave (iii) of {iii}
- Direction: Upside in wave (iii)
Details:
- Recent upmove from the January bottom is unfolding in threes and fours.
- Expecting further bullish momentum before a larger-degree top in wave {iii}.
Conclusion
This equities analysis highlights key market trends across multiple stocks and ETFs using Elliott Wave Theory.
- Stocks like BRK-B, LLY, MELI, and V show impulsive trends, signaling further upside potential.
- Corrective patterns in AVY, PG, and SMH indicate areas where traders should be cautious.
- Key resistance and support levels are critical in confirming future market moves.
More By This Author:
Unlocking ASX Trading Success: James Hardie Industries Plc - Friday, Feb. 28
Elliott Wave Technical Analysis: Euro/U.S. Dollar - Friday, Feb. 28
Elliott Wave Technical Analysis: NEOUSD Crypto Price News For Friday, Feb 28
At TradingLounge™, we provide actionable Elliott Wave analysis across over 200 markets. Access live chat rooms, advanced AI & algorithmic charting tools, and curated trade ...
moreComments
Please wait...
Comment posted successfully
No Thumbs up yet!


.thumb.png.7e56f5d6f13fb88e722d4a72b3ae004c.png)


