


Image Source: Pixabay
Since July 4, 2025, Nvidia (NVDA) has been experiencing a robust rally. The rally is unfolding as a five-wave impulse structure according to Elliott Wave analysis. This upward movement began at a low on July 4, 2025, with wave (1) concluding at $115.44. A subsequent pullback in wave (2) found support at $95.04. This sets the stage for the ongoing wave (3), which has developed as another impulsive subdivision.
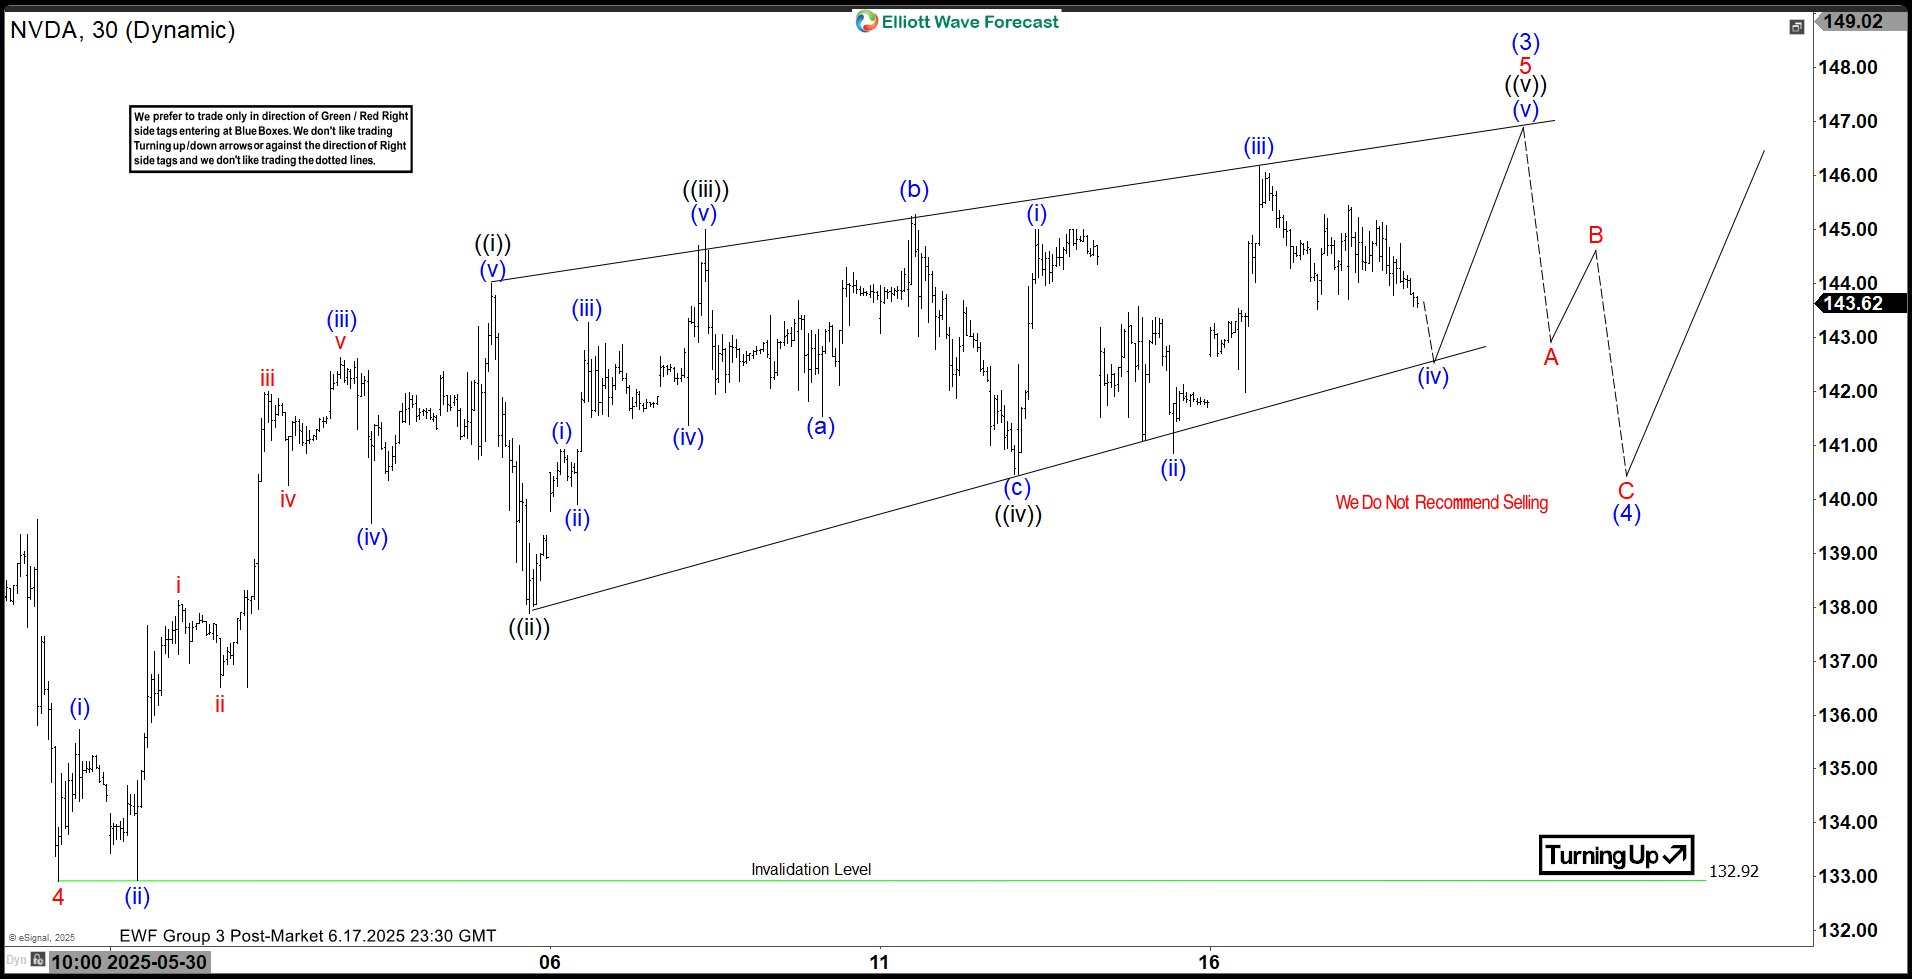
Within wave (3), the stock advanced in wave 1 to $111.92. A brief dip in wave 2 then followed to $104.08. The momentum resumed in wave 3, pushing the stock to $143.84. Afterwards, a corrective wave 4 settled at $132.92, as observed on the 30-minute chart below. Currently, Nvidia is advancing in wave 5 of (3). This wave has seen wave ((i)) peak at $144, followed by a pullback in wave ((ii)) to $137.88. The stock then surged in wave ((iii)) to $145, with a minor correction in wave ((iv)) completing at $140.46.
Wave ((v)) higher should end soon, concluding wave 5 of (3). Following this, a larger-degree wave (4) correction is expected, potentially unfolding in a 3, 7, or 11-swing pattern. This pullback should precede a final ascent in wave (5), completing the cycle from the July 4, 2025 low.
Nvidia (NVDA) 30-Minute Elliott Wave Technical Chart
NVDA Elliott Wave Technical Video
Video Length: 00:08:23
More By This Author:
AMD Elliott Wave Analysis: 5 Wave Rally Supports Bullish BiasIDEX Corporation: Bullish Continuation Expected
Elliott Wave Outlook: Microsoft Surges To Record High, Sustaining Bullish Momentum



Comments
Log in or sign up to join the conversation.