Elliott Wave Outlook: IBEX Poised To Surge To 6-Year High

Image Source: Pixabay
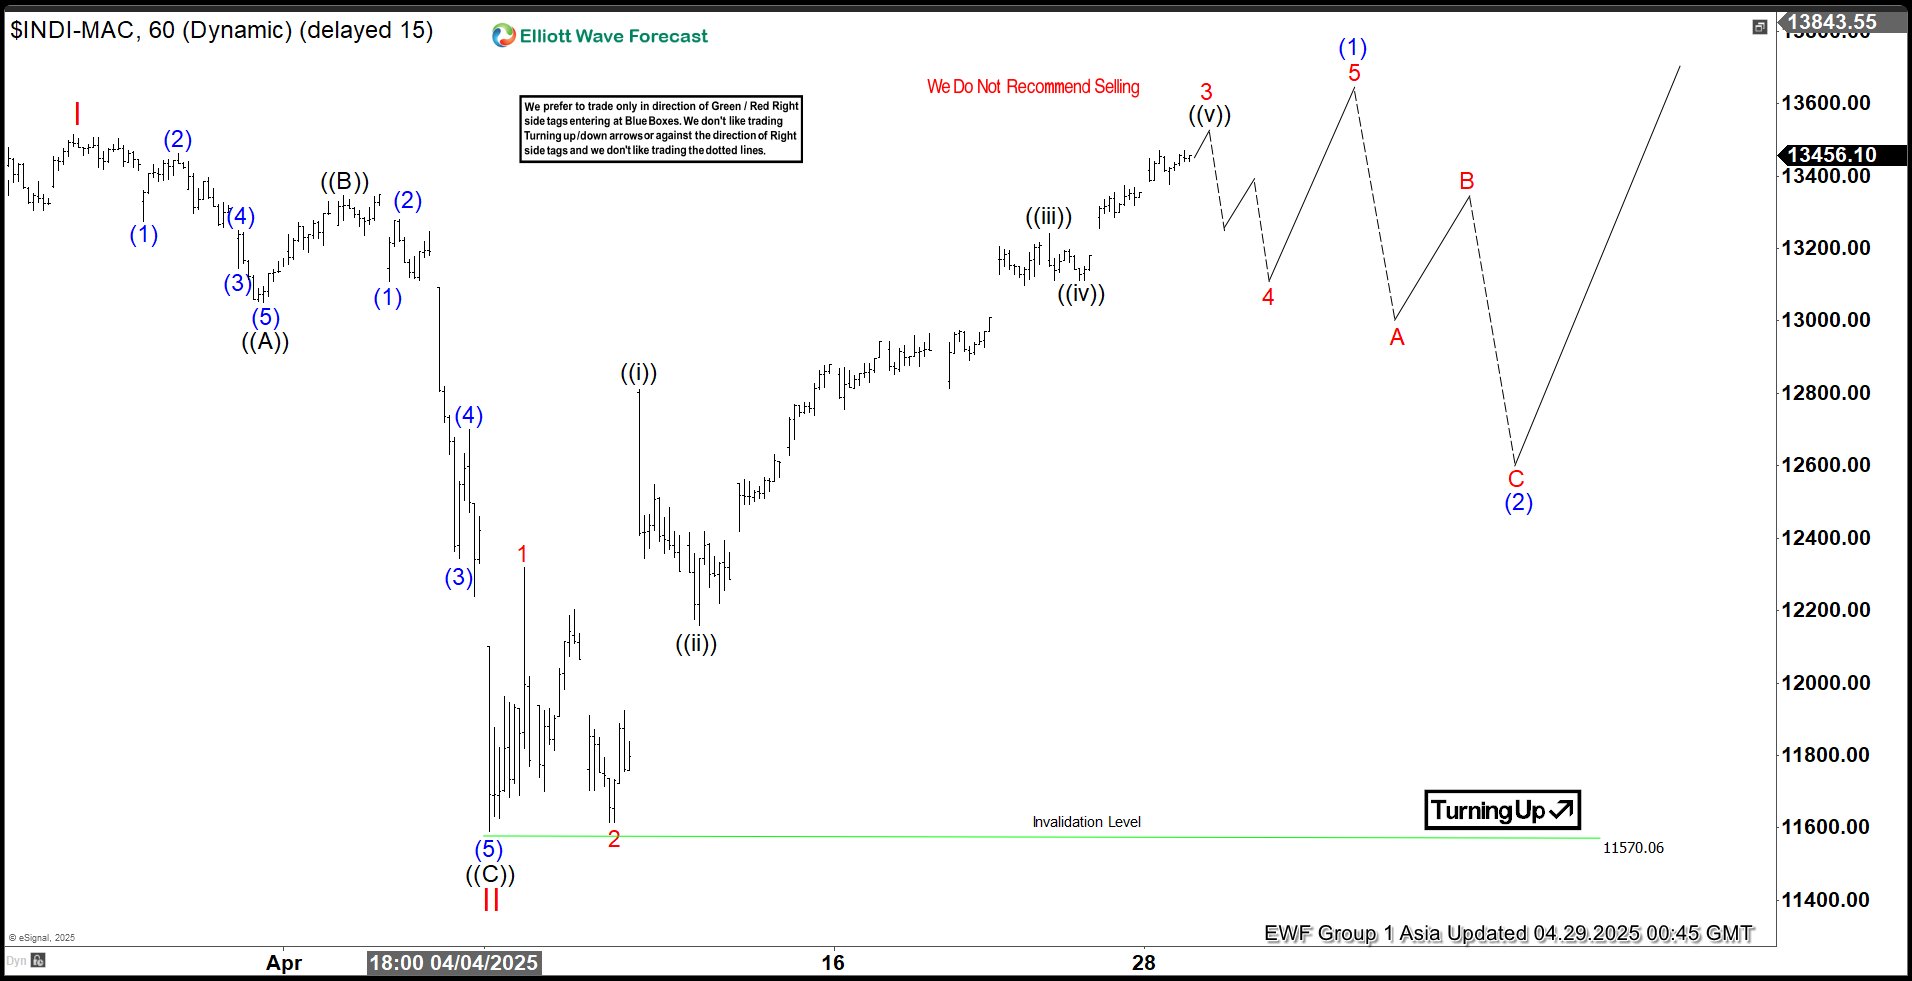
The IBEX, Spain’s stock market index, may soon surpass its peak from March 25, 2025, before a tariff war triggered a selloff. That peak marked the end of wave I in Elliott Wave analysis. The subsequent decline, wave II, formed a zigzag pattern, as shown on the 1-hour chart. From the March 25 high, wave ((A)) dropped to 13,051.8, wave ((B)) rebounded to 13,347.3, and wave ((C)) fell to 11,570.06, completing wave II.
Since then, the $IBEX has recovered strongly, with the rally from wave II following an impulsive Elliott Wave pattern. Starting from wave II, wave 1 peaked at 12,318.8, and wave 2 dipped to 11,615.2. The index then climbed in wave 3, with sub-waves ((i)) at 12,810.8, ((ii)) at 12,158.5, ((iii)) at 13,241.2, and ((iv)) at 13,110.4. The index is expected to soon complete wave ((v)) of 3, followed by a wave 4 pullback, before rising again in wave 5 to finish wave (1).
After that, a correction in wave (2) from the April 7, 2025 low is likely before the index continues higher. In the near term, as long as the 11,570.06 low holds, any pullbacks should attract buyers in a 3, 7, or 11-swing pattern, supporting further gains.
IBEX 60 Minute Elliott Wave Chart
IBEX Video
Video Length: 00:02:46
More By This Author:
Elliott Wave View: USDCHF Zigzag Corrective Rally Expected To FailQQQ Elliott Wave : Forecasting The Rally From Equal Legs Zone
Hindustan Copper Elliott Wave: Blue Box Support Delivers Another Bullish Reversal
Disclaimer: Futures, options, and over the counter foreign exchange products may involve substantial risk and may not be suitable for all investors. Leverage can work against you as well as for ...
more


