Elliott Wave Intraday Analysis: NFLX Should Continue Rally

Image Source: Pexels
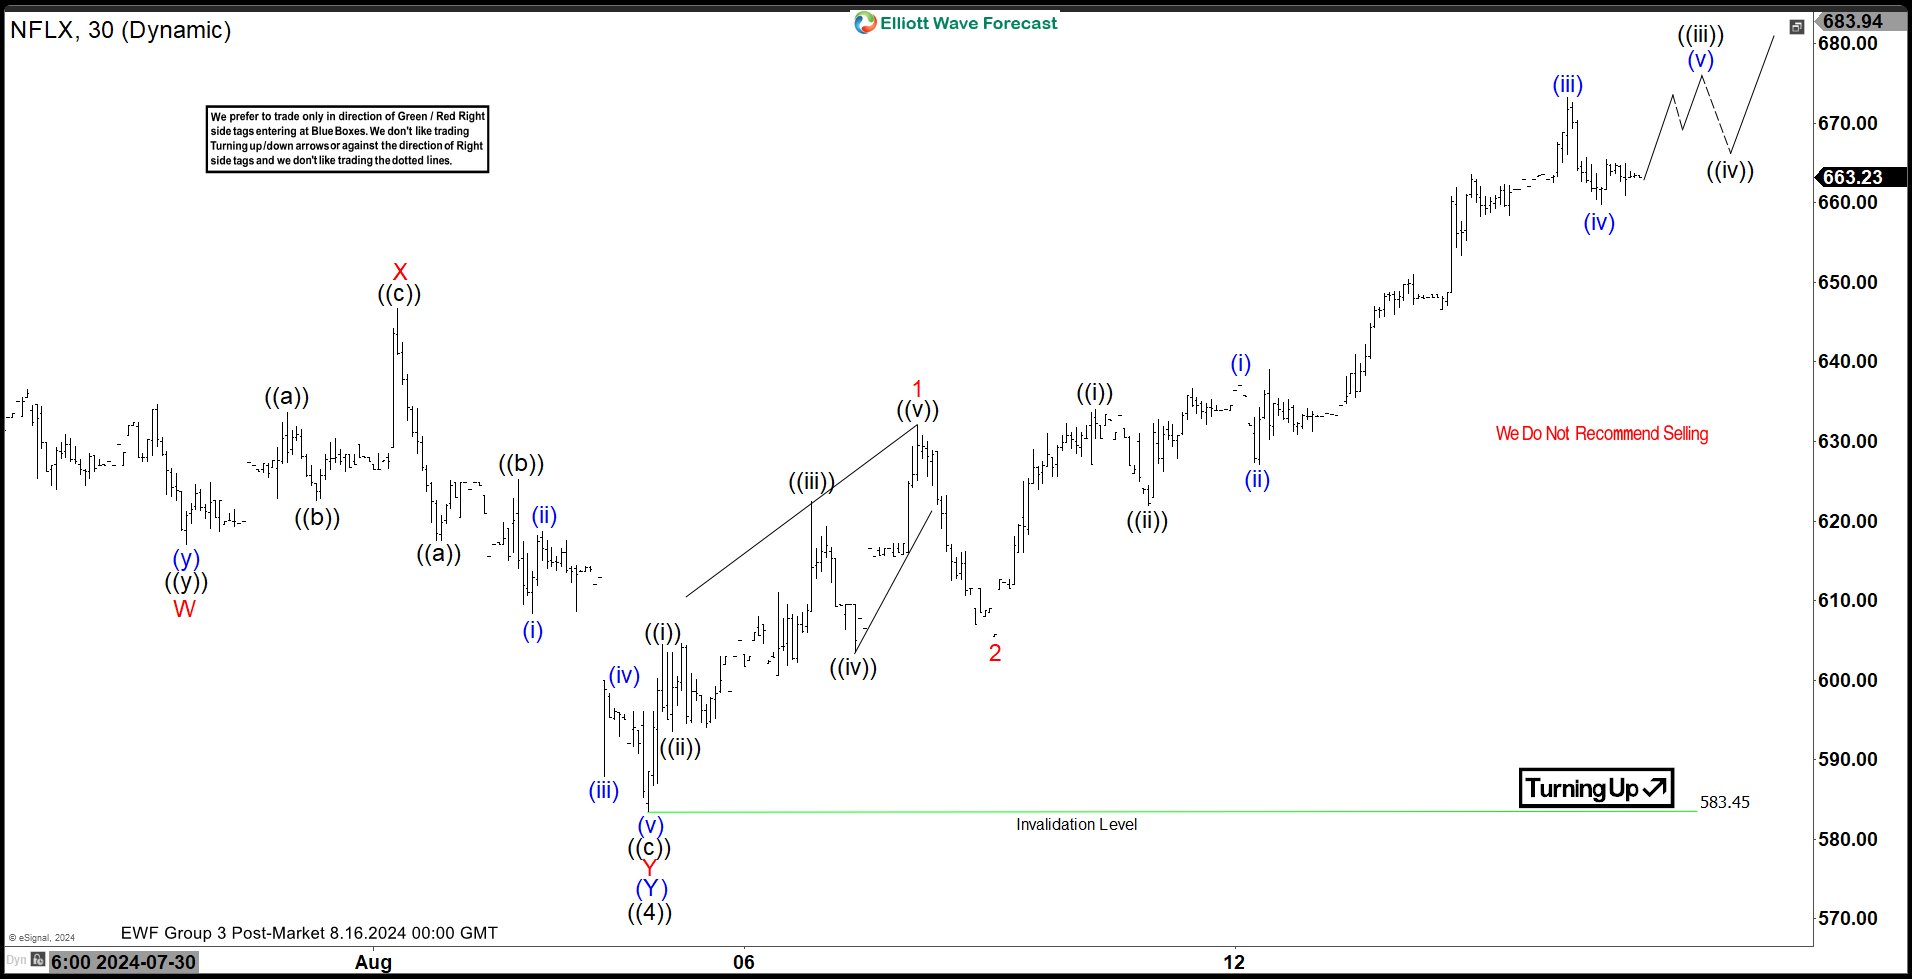
Short Term Elliott Wave in NFLX suggests that the Stock has completed a bearish sequence from 7.05.2024 high. The decline made a double correction Elliott Wave structure. Down from 7.05.2024 high, wave (W) ended at 600.00 low. Rally in wave (X) ended at 678.97 with internal subdivision as a zig zag correction structure. Up from wave (W), wave A ended at 655.54 and wave B ended at 631.50. Wave C higher ended at 678.97 which completed wave (X) in higher degree.
Then, NFLX turned lower in wave (Y) with internal subdivision as another double correction structure. Down from wave (X), wave W ended at 617.00 and wave X ended at 646.71. Last leg wave Y lower ended at 583.50 which completed wave (Y) and ((4)) in higher degree. The current rally is in progress expecting to continue higher as wave ((5)). Near term, we are calling a leading diagonal as wave 1 of (1) of ((5)). This wave 1 ended at 632.00 high and wave 2 pullback finished at 605.50. From this point, the stock resumed to the upside in wave 3 and once the wave 3 is completed, it should see 3, 7 or 11 swings correction as wave 4 before resuming the rally again.
NFLX 30 Minutes Elliott Wave Chart
NFLX Elliott Wave Video
Video Length: 00:03:02
More By This Author:
ONEOK Should Continue Rally In Bullish SequenceNASDAQ Nice Reaction Higher From Blue Box Area
The Future Of Copper And A Look Back – Trading Review
Disclaimer: Futures, options, and over the counter foreign exchange products may involve substantial risk and may not be suitable for all investors. Leverage can work against you as well as for ...
more


