Elliott Wave Forecast: Nike Rally To Fail In 7-Swing Pattern
Image Source: Unsplash
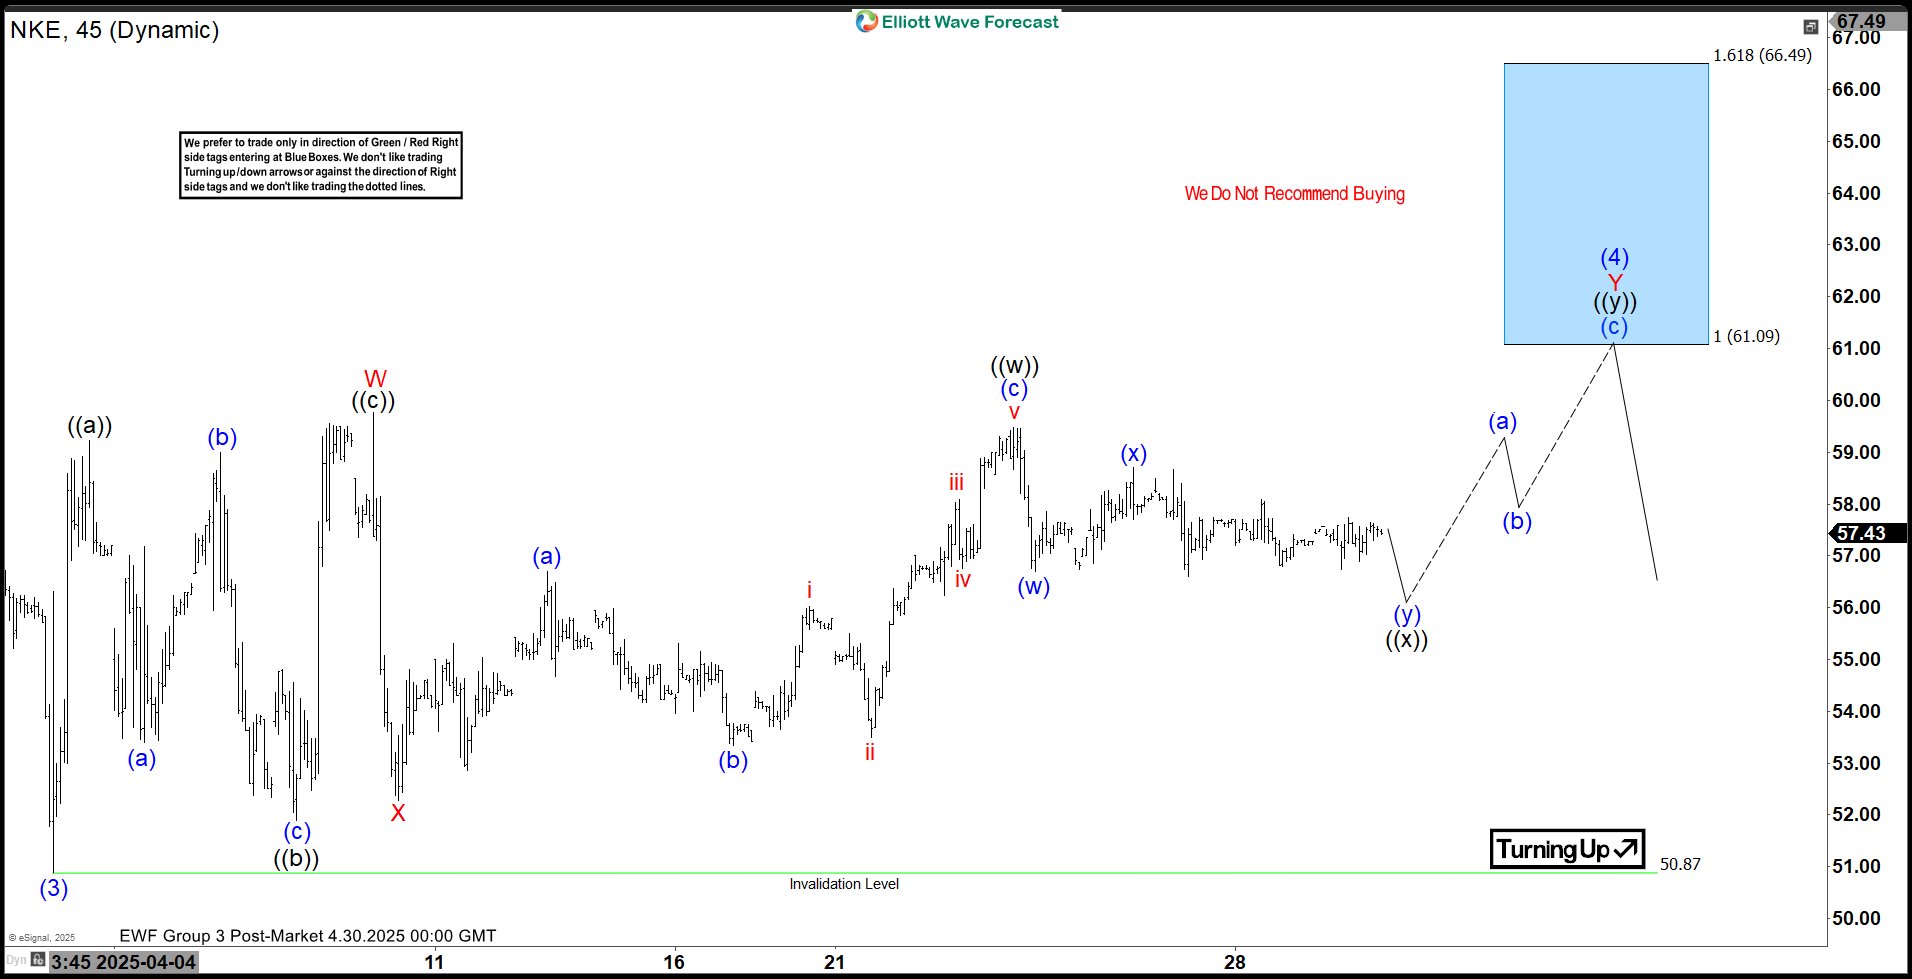
Nike (NKE) shows a bearish trend that began at its peak on November 8, 2021, indicating potential for further declines. On a shorter cycle, the stock’s drop from its October 1, 2024 high is developing as an impulsive Elliott Wave structure, characterized by sharp downward moves. From that high, wave (1) concluded at $68.62, followed by a wave (2) recovery that peaked at $82.44. The stock then continued its descent in wave (3), reaching $50.87, as illustrated in the 45-minute chart below.
Currently, Nike is in a corrective phase, forming wave (4) as a double three Elliott Wave pattern. From the wave (3) low, wave ((a)) rose to $59.22, followed by a wave ((b)) dip to $51.90. The subsequent wave ((c)) advance ended at $59.76, completing wave W. A pullback in wave X bottomed at $52.28, and the stock is now progressing in wave Y, structured as another double three pattern. From wave X, wave ((w)) reached $59.48. A brief pullback in wave ((x)) is expected to conclude soon, setting the stage for wave ((y)) to push toward the blue box zone of $61.09–$66.49. Sellers are likely to emerge in this area, potentially driving the stock lower again.
Nike (NKE) 45-Minute Elliott Wave Chart
Nike Video Analysis
Video Length: 00:03:02
More By This Author:
Elliott Wave Outlook: IBEX Poised To Surge To 6-Year HighElliott Wave View: USDCHF Zigzag Corrective Rally Expected To Fail
QQQ Elliott Wave : Forecasting The Rally From Equal Legs Zone
Disclaimer: Futures, options, and over the counter foreign exchange products may involve substantial risk and may not be suitable for all investors. Leverage can work against you as well as for ...
more


