Elliott Wave Expects S&P 500 E-Mini Futures Tto Continue Higher

Image Source: Pexels
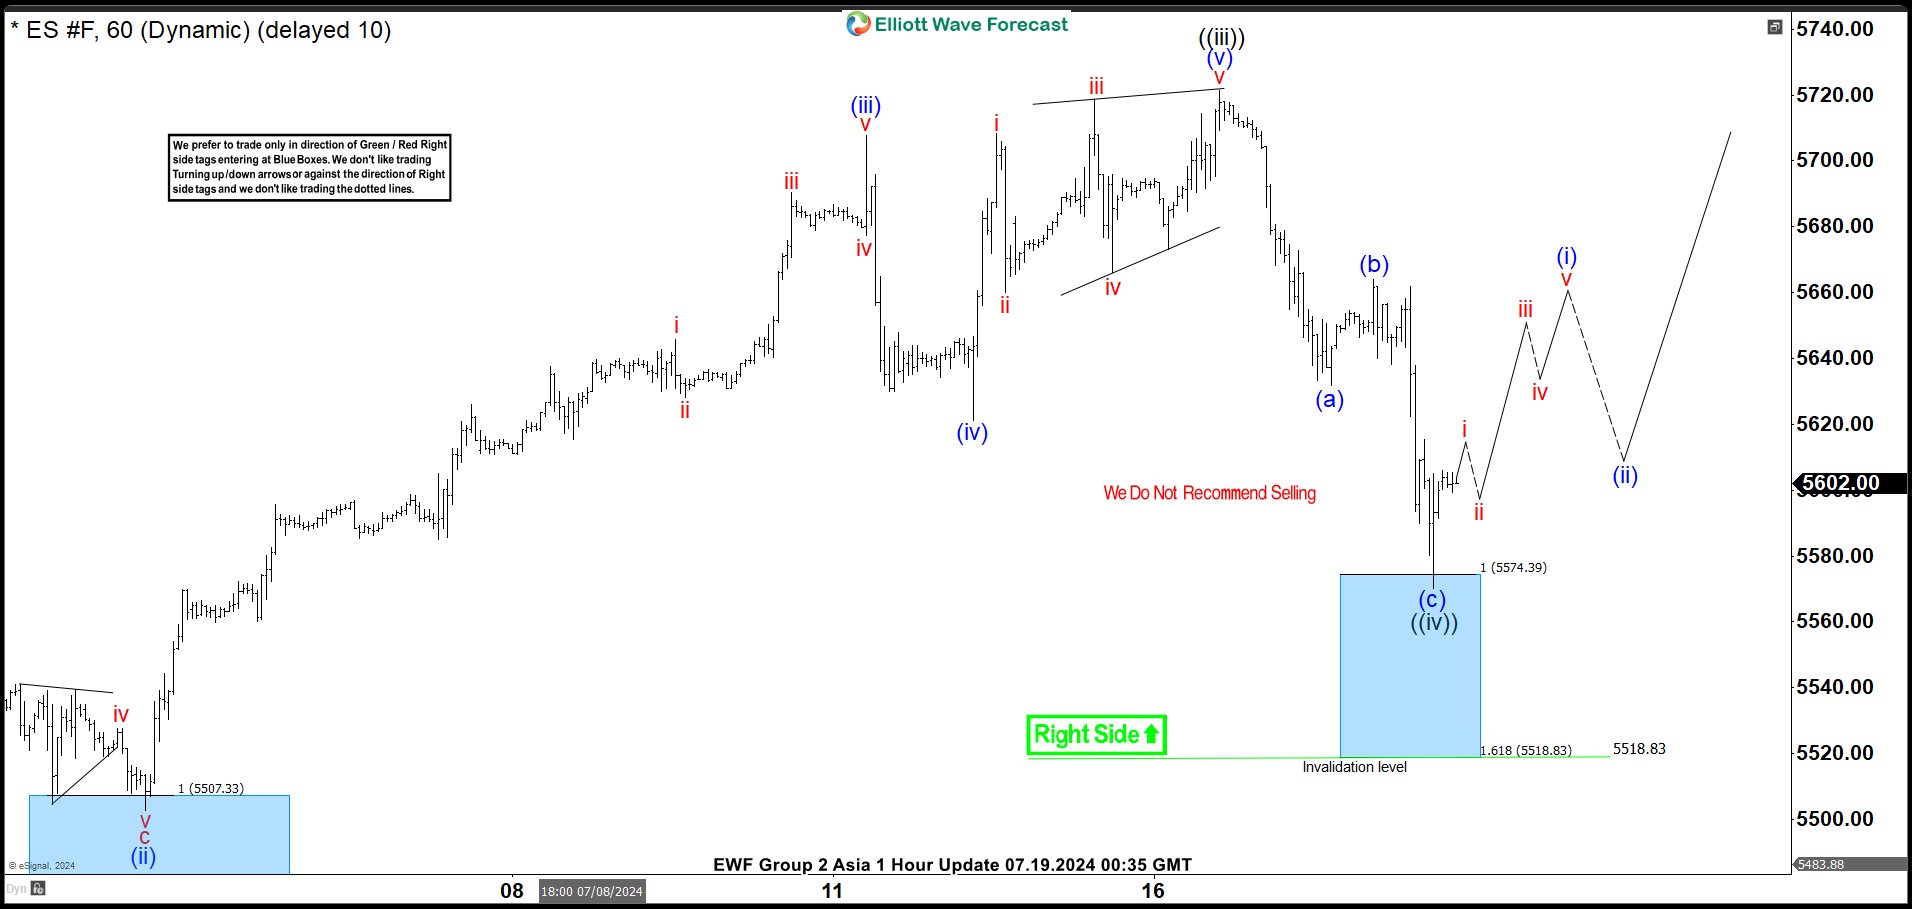
Short Term Elliott Wave View in S&P 500 E-Mini Futures (ES) suggests rally from 5.2.2024 low is in progress as a 5 waves impulse. Up from 5.2.2024 low, wave ((i)) ended at 5368.25 and dips in wave ((ii)) ended at 5205.50. The Index has extended higher again from there. Up from wave ((ii)), wave (i) ended at 5588 and wave (ii) pullback ended at 5502.75. Rally in wave (iii) ended at 5707.75 and pullback in wave (iv) ended at 5621.25. Final leg wave (v) unfolded as a diagonal and ended at 5721.25 which also completed wave ((iii)) in higher degree.
Pullback in wave ((iv)) has subdivision of a zigzag Elliott Wave structure. Down from wave ((iii)), wave (a) ended at 5631.75 and rally in wave (b) ended at 5664. Final leg wave (c) lower is proposed complete at 5570.25 at the blue box extreme area. This area is based on the 100% – 161.8% Fibonacci extension from 7.17.2024 high which comes at 5518.13 – 5574.3. Wave ((iv)) ended inside this blue box area and the Index has since reacted higher from the blue box. After the reaction, it now needs to break above wave ((iii)) at 5721.25 to rule out a double correction in wave ((iv)). Near term, as far as it stays above 5518.13, expect the Index to extend higher.
S&P 500 E-Mini Futures (ES) 60 Minutes Elliott Wave Chart
ES_F Elliott Wave Video
Video Length: 00:08:35
More By This Author:
Elliott Wave Intraday: Rally In Bitcoin Looking ImpulsiveElliott Wave Intraday: Gold Breaks To New All-Time High
Elliott Wave Suggests Right Side In Dow Futures Firmly Bullish
Disclaimer: Futures, options, and over the counter foreign exchange products may involve substantial risk and may not be suitable for all investors. Leverage can work against you as well as for ...
more


