
Elliott Wave Analysis: S&P 500 And DAX Approaching Support
The USD is seen in a bullish structure vs other major currencies, so we should be aware of more risk-off in the near term.
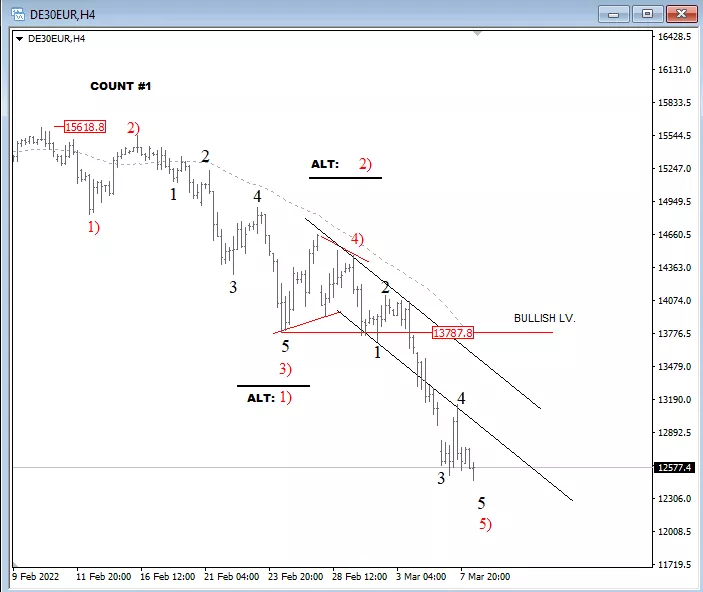
DAX is falling sharply and impulsively from the all-time highs, so seems like it's trading now in a monthly higher degree A)-B)-C) corrective decline, where wave A) on a daily chart could be still in progress. Looking at the 4-hour chart, we can see it now trading in wave 5 of an extended wave 5) or alternatively wave 3), so be aware of rebound and recovery at least in three waves back to 13k area soon.
DAX 4h Elliott Wave Analysis
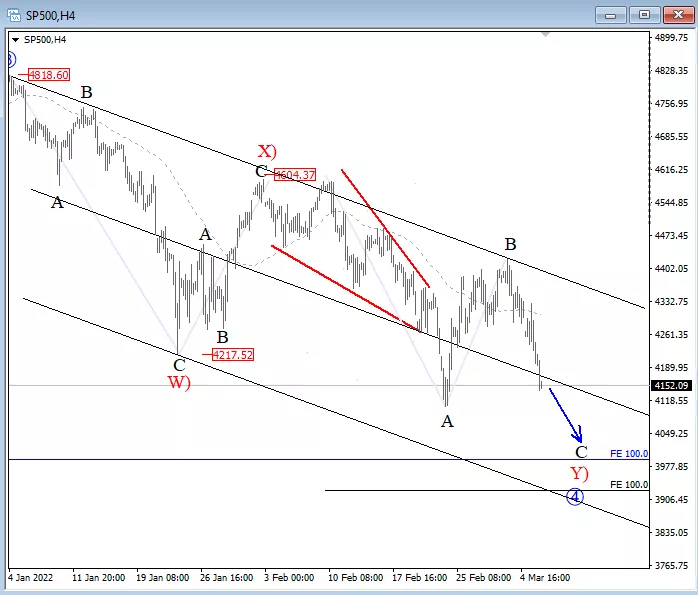
US stocks are still falling following EU and China stock market sell-off, but US stocks are doing quite well, and we still see SP500 in corrective movement from the highs, ideally within a complex (W)-(X)-(Y) pattern which can be nearing the end. We actually see SP500 trading in the final stages of wave C of (Y), where ideal support would be around that Fibo. Cluster target and 4000 - 3900 area.
S&P500 4h Elliott Wave Analysis
Disclosure: Please be informed that information we provide is NOT a trading recommendation or investment advice. All of our work is for educational purposes only.


