Elliott Wave Analysis Expects Nasdaq Futures Continue Higher
Image Source: Unsplash
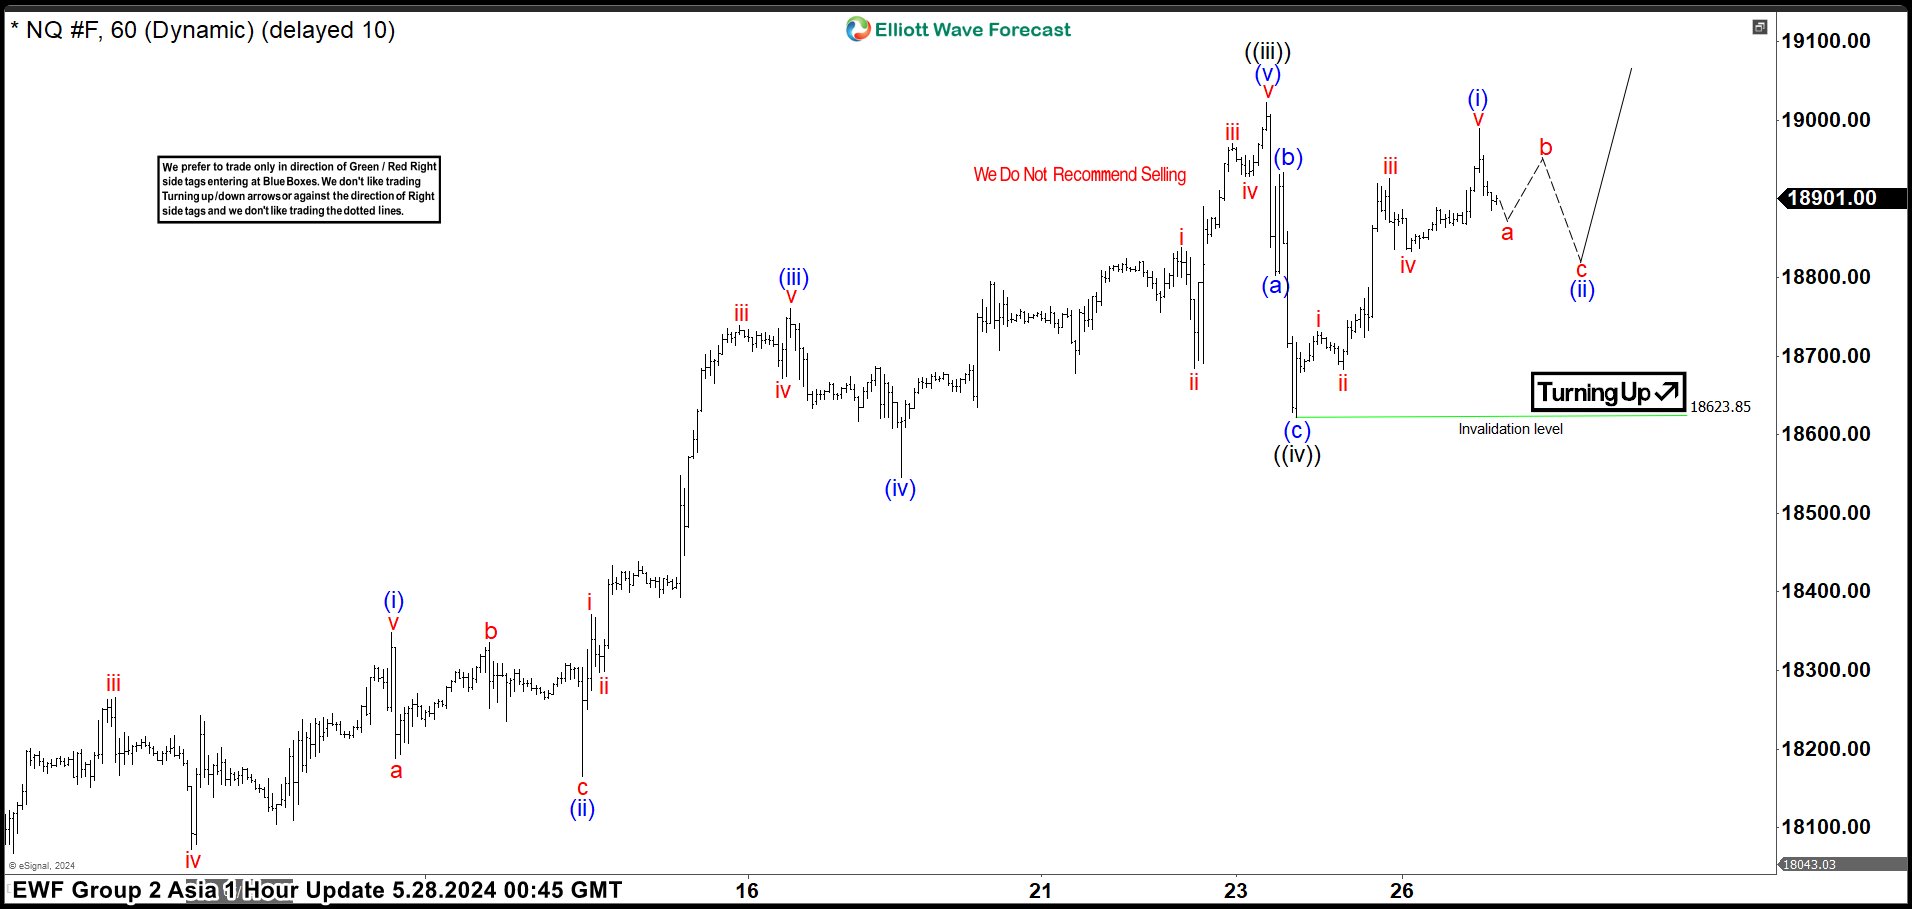
Short Term Elliott Wave in Nasdaq Futures (NQ) suggests the rally from 4.19.2024 low is in progress as an impulse. Up from 4.19.2024 low, wave ((i)) ended at 17949 and dips in wave ((ii)) ended at 17386. The NQ extended higher in wave ((iii)) with internal subdivision as another impulse in lesser degree. Up from wave ((ii)), wave (i) ended at 18348 and dips in wave (ii) ended at 18165. Wave (iii) ended at 18760, wave (iv) ended at 18545, and wave (v) ended at 19023 which completed wave ((iii)).
Wave ((iv)) pullback did a zig zag Elliott Wave structure. Down from wave ((iii)), wave (a) ended at 18802 and pullback in wave (b) ended at 18933. Final leg wave (c) completed wave ((iv)) at 18621 low. The future rallied again in wave ((v)) ending an impulse as wave (i) of ((v)) at 18956 high. Near term, as far as pivot at 18621 low stays intact, expect a correction in 3 or 7 swings in wave (ii) before resuming to the upside in wave (iii) of ((v)). It expect short term upside in ((v)) towards 19117 – 19270 area as minimum extension, while dips remain above 18623.85 low. Alternatively, it can do double, if break below 18623.85 low as ((iv)) before turning higher.
Nasdaq Futures (NQ) 60 Minutes Elliott Wave Chart
Nasdaq Futures (NQ) Elliott Wave Video
Video Length: 00:05:04
More By This Author:
SMH Semiconductor ETF Reacted From A Blue Box Breaking To New HighsElliott Wave Analysis On Tesla Suggests A Double Correction
Elliott Wave Analysis On Oil Looks For Short Term Weakness
Disclaimer: Futures, options, and over the counter foreign exchange products may involve substantial risk and may not be suitable for all investors. Leverage can work against you as well as for ...
more


