Dr. Reddy's Laboratories – Elliott Wave Technical Analysis
DR REDDY'S LABORATORIES (RDY) – DRREDDY (1D Chart) Elliott Wave Technical Analysis
Function: Counter Trend (Minor degree, Grey)
Mode: Corrective
Structure: Zigzag/Flat unfolding
Position: Impulse drop complete at Minuette Degree. Not labelled
Details: A Minuette impulse wave looks complete within Minor Wave 4 Grey against 7110-20 mark. If correct, expect slight pullback higher before turning lower again.
Invalidation point: 7110-20
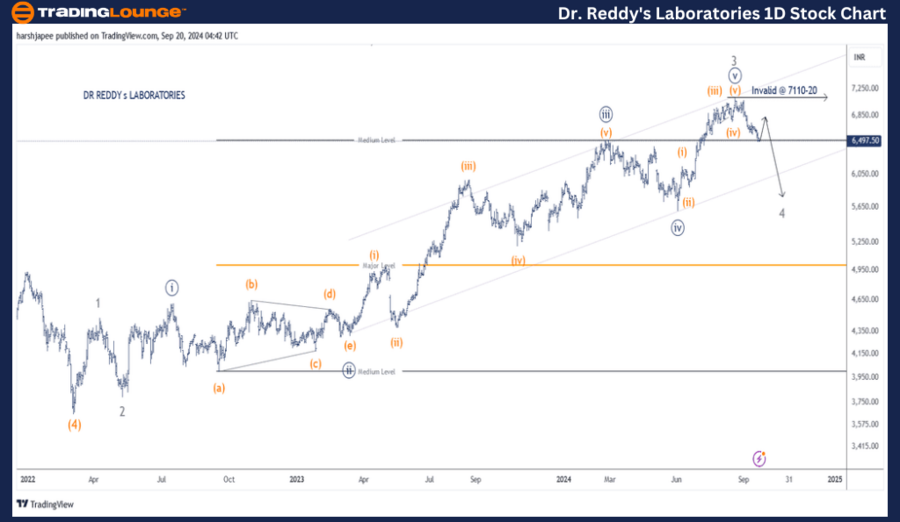
Dr Reddy's Laboratories Daily Chart Technical Analysis and potential Elliott Wave Counts:
Dr Reddy's Laboratories daily chart is indicative of a potential correction underway towards 5600 levels as Minor Wave 4 progresses. Minor Wave 3 Grey looks complete at 7110, which was registered on August 21, 2024. Ideally, a zigzag is underway against that high.
Dr Reddy's had registered a low around 2645 mark in March 2022, terminating Intermediate Wave (4) Orange. Since then, Intermediate Wave (5) is progressing and has completed Minor Waves 1 through 3. Minute Wave ((iii)) is extended as marked on the chart, terminating around 6500-10 zone.
If the above proposed count is correct, Minor Wave 4 might be progressing towards 5600-10 range, the previous 4th wave of a lesser degree against 7110. Alternatively Minute Wave ((v)) is still progressing higher within Minor Wave 3 and could push above 7110-20 mark.
(Click on image to enlarge)
DR REDDY'S LABORATORIES – DRREDDY (4H Chart) Elliott Wave Technical Analysis
Function: Counter Trend (Minor degree, Grey)
Mode: Corrective
Structure: Zigzag/Flat unfolding
Position: Impulse drop complete at Minuette Degree. Not labelled
Details: A Minuette impulse wave looks complete within Minor Wave 4 Grey against 7110-20 mark. This could be Wave (a) of a potential Zigzag. If correct, expect slight pullback higher before turning lower again.
Invalidation point: 7110-20
Dr Reddy's Laboratories 4H Chart Technical Analysis and potential Elliott Wave Counts:
Dr Reddy's Laboratories 4H chart is highlighting he sub waves within Minute Wave ((v)) of Minor Wave 3 and further. The above could be seen as an impulse and complete around 7110-20. Thereafter, the drop towards 6490 looks an impulse at Minuette degree.
If correct, prices should ideally push higher from here towards 6790 to complete a correction, before turning lower again.
Conclusion:
Dr Reddy's Laboratories is progressing lower within a counter trend zigzag to terminate Minor Wave 4 Grey around 5600 levels. Once complete, the larger degree uptrend would resume higher towards 7110-20.
(Click on image to enlarge)
Technical Analyst : Harsh Japee
More By This Author:
Unlocking ASX Trading Success: BLOCK INC. Stock Analysis & Elliott Wave Technical Forecast - Friday, September 20
Elliott Wave Technical Analysis: Uniswap Crypto Price News For Friday, Sept 20
Tata Steel – Elliott Wave Technical Analysis
Analyst Peter Mathers TradingLounge™ Australian Financial Services Licence - AFSL 317817


.thumb.png.a03aa66bc8eb15ffa45349ecc8cbd48f.png)


