Tuesday, May 18, 2021 5:30 PM EST
The Dow Jones has been an outstanding performer among the three US indices over the last few months as the ongoing reflation trade helps to bolster many of its constituents. The same forces that have helped drive the Dow higher have worked to cripple the high-flying technology stocks of the Nasdaq 100 and many leaders of the S&P 500. As a result, the Dow Jones is the only index among them that remains above its broader uptrend and it could help the index avoid deeper declines if volatility continues.
DOW JONES PRICE CHART: WEEKLY TIME FRAME (JANUARY 2018 – MAY 2021)
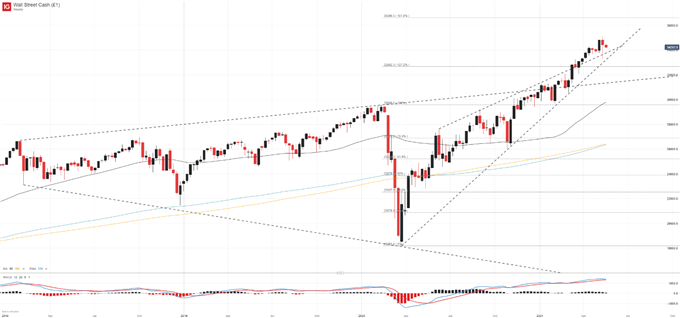
The trendline in question is derived from the index’s pandemic low in March 2020 and has influenced price throughout the time since. While the Nasdaq 100 and S&P 500 have since broken beneath their respective trendlines, the Dow enjoys a supplementary level of support derived from various market peaks throughout the last fifteen months. As it stands, the two trendlines converge near the 34,000 mark and will look to keep the Industrial Average afloat.
WALL STREET (DOW JONES) CLIENT SENTIMENT AND PRICE CHART
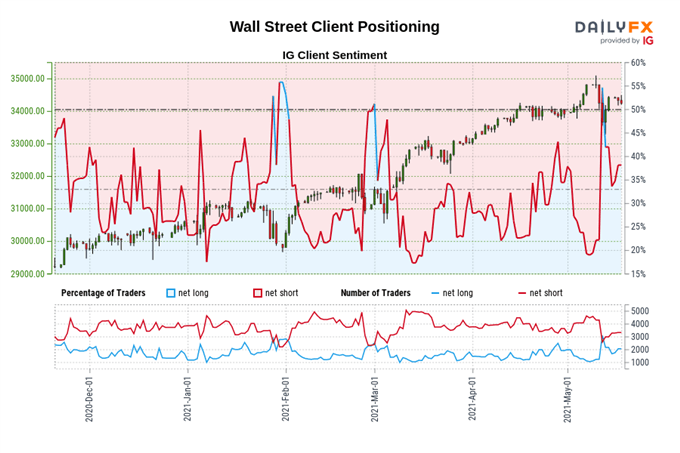
With that in mind, client positioning data may suggest the Dow is at risk. While traders remain net-short, the number of traders net-short has decreased to its lowest levels since March 2021. Since we typically take a contrarian view to crowd sentiment, a flip to net-long may suggest the index will continue to fall.
Such a shift in client positioning might also coincide with a trendline break which would effectively open the door to deeper losses for the Industrial Average. Until such a break occurs, however, convergent support near 34,000 will remain the “line in the sand” for the index.
Disclaimer: DailyFX, the free news and research website from IG, is one of the world's leading sources for news and analysis on the ...
more
Disclaimer: DailyFX, the free news and research website from IG, is one of the world's leading sources for news and analysis on the currency, commodity and index trading community. With nine internationally-based analysts publishing over 30 articles and producing 5 video news updates daily, DailyFX offers in-depth coverage of price action, predictions of likely market moves, and exhaustive interpretations of salient economic and political developments. DailyFX is also home to one of the most powerful economic calendars available on the web, complete with advanced sorting capabilities, detailed descriptions of upcoming events on the economic docket, and projections of how economic report data will impact the markets. Combined with the free charts and live rate updates featured on DailyFX, the DailyFX economic calendar is an invaluable resource for traders who heavily rely on the news for their trading strategies. Additionally, DailyFX serves as a portal to one of the most vibrant online discussion forums in the forex trading community. Avoiding market noise and the irrelevant personal commentary that plague many forex blogs and forums, the DailyFX Forum has established a reputation as being a place where real traders go to talk about serious trading.
Any opinions, news, research, analyses, prices, or other information contained on dailyfx.com are provided as general market commentary and does not constitute investment advice. Dailyfx will not accept liability for any loss or damage, including without limitation to, any loss of profit, which may arise directly or indirectly from use of or reliance on such information.
less
How did you like this article? Let us know so we can better customize your reading experience.


