

The monthly chart of the Dow highlights the path it and the general markets could follow, with such a path appearing similar to the 1973-74 and 2008-09 eras. More attention is being given to the former dates, as there are more similarities between the two timeframes—for example, inflationary forces, war, etc.
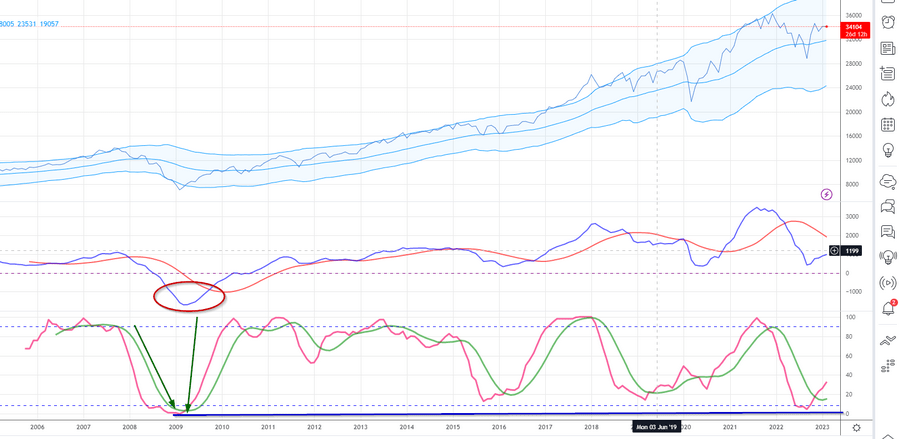
Let’s start by looking at the 2008-2009 pattern. The 2008 financial crisis provides valuable insights into the market trends, particularly in regards to the Dow Jones outlook. The MACD moved from extremely oversold to insanely oversold ranges, followed by a prolonged period of RSI in the oversold ranges.
This pattern suggests that extreme market corrections are followed by extended bull markets, resulting in significant gains for investors who approached the market in a calculated and emotionless manner.
However, it’s essential to remember that investing should always be approached with a clear and rational mindset, as emotions have the potential to impact investment decisions and lead to suboptimal outcomes. In other words, park your emotions outside or they will drive you out of the game. Sometimes bears win and sometimes bulls win, but pigs always get slaughtered.
Dow Jones Outlook: Historical Chart of the Dow (1963 to 1977)
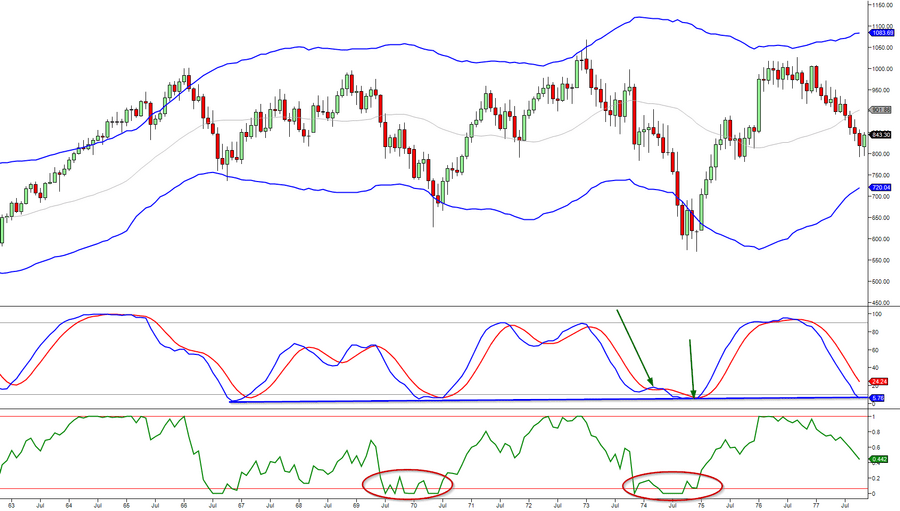
In both timeframes of 2008-09 and 1973-74, when the MACDs hit the extreme oversold zone and the RSI traded sideways in the highly oversold zone for an extended period, the Dow Jones discovered new lows or tested the previous lows.
What happened in 2008-09 also took place in 1973-74, where the MACD moved from the highly oversold zone to the insanely oversold zone (illustrated by the green arrows in the chart above) and traded to new lows.
From a low of roughly 573 (seen in October 1974) to a high of 1018 (seen in March 1976), the Dow Jones tacked on a stunning 77%. This proves, once again, that crisis investing pays off handsomely. However, one has to have the fortitude to understand that significant gains don’t come easy. If it were truly that easy, every individual with a PhD in economics would be a multi-millionaire.
Whenever the MACDs trades to new lows and the RSI trades sideways for an extended period of time, it indicates a decisive upward move is in the works for the Dow Jones.
In summary, when it looked like the markets were ready to bottom, they mounted fake rallies and the MACDs traded to new lows instead of experiencing a bullish crossover. In the process, the RSI traded sideways for an extended period. The only difference between the two time periods (1973-74 and 2008-09) and today is that if the MACDs trade to new lows, this would satisfy one key ingredient for the 'father of all buys.'
Suppose this condition is met. The odds of a 'father of all buys' being triggered for the Dow Jones would rise to 60%. So, that’s how valuable this criterion is if it comes to pass.
At a minimum, there must be a 12-year gap between the lows. If the MACDs trade to new lows today, the gap would amount to roughly 14 years—the more significant the time gap, the better the opportunity. Taking an educated guess, as things currently stand in the market, there is a 60% chance that at least a 'mother of all buys' may be triggered for the Dow Jones.
Conclusion
The outlook for the Dow Jones is interesting, as it keeps issuing new signs of strength almost on a weekly basis. This is why we keep raising the trigger points. Technically, there are some indications that the Dow could rally until late December and possibly early January. This, in turn, means there is still time for the Nasdaq to mount a blistering turnaround.
The Nasdaq could easily tack on 2000+ points in under 21 trading days. That’s how coiled up it is. However, can and will are not the same thing. Hence it’s best to wait for more data to come in before turning aggressive.
Once the Dow hits 32,9100, high-risk players should consider abandoning the strategy mentioned above. Instead, focus on slowly banking gains on the longs opened when the markets were tanking.
In general, risk-takers should use rallies to trim the longs they opened when the markets were correcting. That is, unless the Nasdaq or Russell 2000 give new buy signals. If this happens, risk-takers may look to deploy capital into companies in the Nasdaq or Russell 2000.
The following are a few sources that provide research on the benefits of crisis investing.
The Global Financial Crisis and the Investment Management Industry – McKinsey & Company
- This research report provides insights into how the investment management industry was affected by the 2008 financial crisis and highlights the benefits of crisis investing, including the opportunity to acquire high-quality assets at attractive prices.
Dow Jones Outlook: Navigating Market Volatility Through Crisis Investing – The Journal of Alternative Investments
- This study analyses the impact of market volatility on the Dow Jones and explores crisis investing as a strategy to navigate uncertainty and achieve long-term investment goals.
Opportunities in Crisis Investing – Cambridge Associates
- This publication provides an overview of crisis investing and the opportunities it presents, including the ability to invest in high-quality assets at lower valuations, to take advantage of market inefficiencies, and to benefit from the eventual recovery of the market.
More By This Author:
What Is An ETF? A Beginner’s Guide To Exchange-Traded Funds
Existing Home Sales
Broad Market Review


Comments
Log in or sign up to join the conversation.