
Dow Jones (DJI) Index - Elliott Wave Technical Analysis
DOW JONES (DJI) – Elliott Wave Analysis | Daily & Weekly Charts
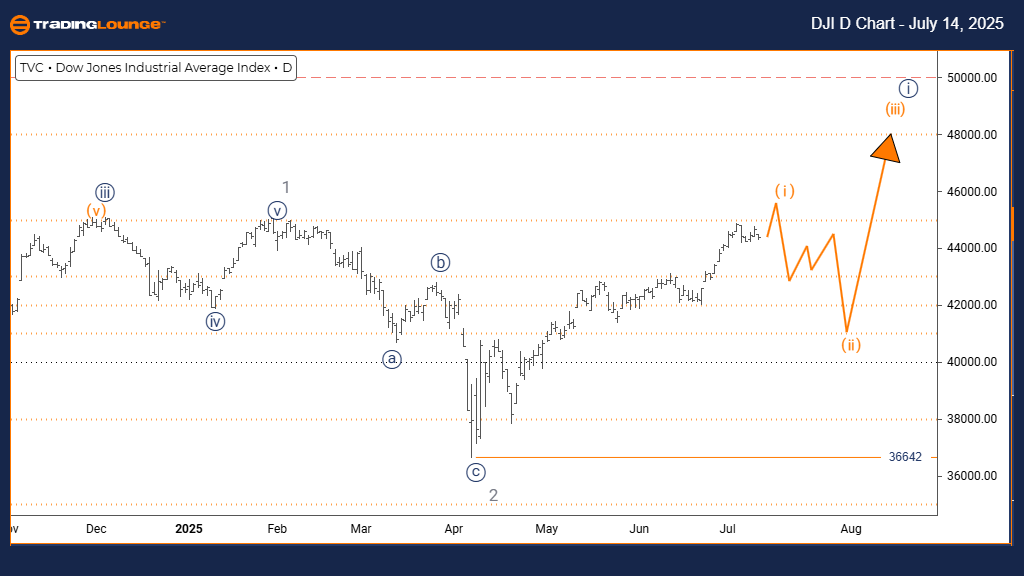
DJI Elliott Wave Technical Analysis – Daily Chart
Function: Bullish Trend
Mode: Impulsive
Structure: Orange Wave 1
Position: Navy Blue Wave 1
Direction (Next Lower Degrees): Orange Wave 2
Details: Gray wave 2 appears completed; orange wave 1 of navy blue wave 1 is currently in play.
Invalidation Level: 36642
The daily chart of the DOW JONES Industrial Average shows a market in the early stages of a new bullish impulsive sequence. The index has begun forming orange wave 1 within the broader structure of navy blue wave 1, suggesting renewed upward momentum after the completion of gray wave 2.
This impulsive configuration implies strong buyer engagement, supported by a pattern of higher highs and higher lows. The expected next phase, orange wave 2, would be a corrective retracement, offering a potential setup for traders to join the trend after confirmation of orange wave 1’s completion.
The analysis identifies 36642 as the invalidation level, serving as a vital technical marker. A break below this point would nullify the current bullish count and call for reassessment. Until then, this structure offers a framework for trend-following strategies, with the current leg possibly representing the beginning of a more extended advance.
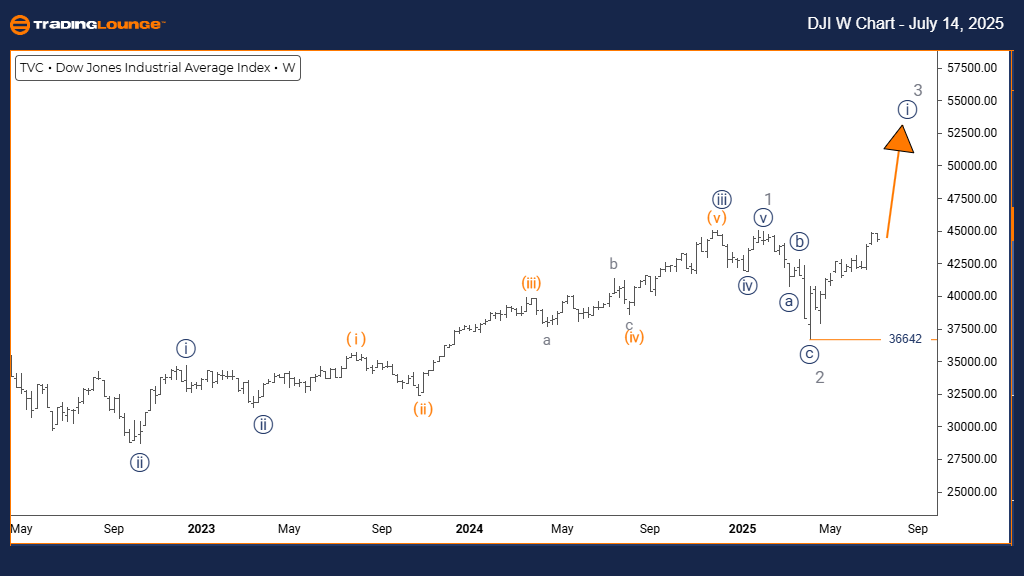
DJI Elliott Wave Technical Analysis – Weekly Chart
Function: Bullish Trend
Mode: Impulsive
Structure: Navy Blue Wave 1
Position: Gray Wave 3
Direction (Next Lower Degrees): Navy Blue Wave 2
Details: Gray wave 2 appears complete; navy blue wave 1 of gray wave 3 is developing.
Invalidation Level: 36642
On the weekly chart, the DOW JONES is firmly positioned within an impulsive structure. The index has moved into navy blue wave 1 of a larger gray wave 3, typically the most dynamic phase in an Elliott Wave sequence.
This structure reflects strong upward momentum, supported by extended wave formations and aggressive buying. Once navy blue wave 1 concludes, a pullback in navy blue wave 2 is expected, presenting another potential entry point within the larger trend.
The 36642 level remains a critical invalidation threshold. Price stability above this level confirms the bullish interpretation and supports further upside. The current setup suggests the broader market may experience significant strength and duration, consistent with third wave behavior.
Traders can utilize this perspective to align with the prevailing long-term uptrend, while staying alert for corrections that may offer well-defined, low-risk trade opportunities.
Technical Analyst: Malik Awais
More By This Author:
Elliott Wave Technical Analysis: Euro/U.S. Dollar - Monday, July 14
Dogecoin Crypto Price News Today - Monday, July 14
Unlocking ASX Trading Success: BHP Group Ltd. (BHP)
At TradingLounge™, we provide actionable Elliott Wave analysis across over 200 markets. Access live chat rooms, advanced AI & algorithmic charting tools, and curated trade ...
more

