
Double Bottom Leaders
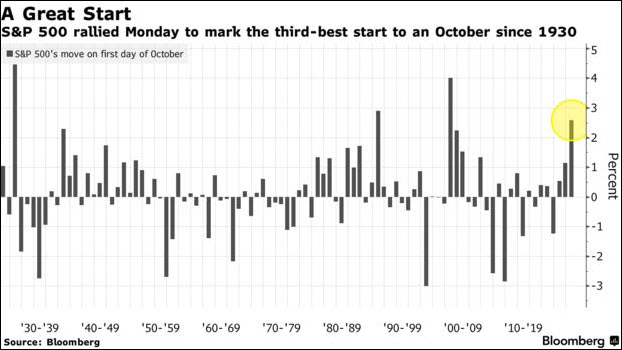
Monday’s rally was the 3rd best performance for the first trading day of October since 1930. When followed by yesterday’s rally, the two-day rally became the strongest since April 2020 when the market was roaring back from the pandemic crash.
This rally comes at a very pivotal point in the bear market’s trend as you can see from the weekly chart below. The SPY in the chart is sitting on its 200-week moving average and at the 50% correction level from the pandemic low bull market.
Plus, weekly Real Motion on two time frames and the price of the SPY are all oversold based on their Bollinger Bands. As I wrote in a recent email two days ago, if the market rallies over the prior week’s high this setup could lead to a bear market rally.
The rally in the last two days has exceeded last week's high. The next confirmation would be to close over that level (372.20).

For Real Motion users, a good setup to look for right now is bullish Real Motion divergence. There are few shown below.
If you don’t know what Real Motion is because it’s an indicator you can only access through MarketGauge.
Here are the basics quickly. I’ve labeled the basic divergence on the chart.
The divergence is identified as the positive moving average stack (blue 50-day over green 200-day in Real Motion while the price has the blue average (50-day under the green 200-day).
This Real Motion divergence on 50 and 200-day averages identifies stocks (or any market) that can provide great 200-day breakout trades, and opportunities to buy pullbacks to price and Real Motion support levels when done correctly.
Here are some current setups with levels to watch for trading opportunities.
Look for a breakout over consolidation or a pullback to the $90 level. TTC.

Look for a breakout over the trend line or support at the 50-day. MELI.

Look for a breakout over the 50-day. PYPL.

Look for a breakout over yesterday, and then over $90. SBUX.

This is an advanced setup. Note how Real Motion found support around its 200-day. Look for a continuation over yesterday's high. DIS.

More By This Author:
Weekly Market Outlook: Friday's Wake Up Warning For The Bulls
How To Play The Biggest Bubble "Inside" The Stock Market Since The Dot.com Collapse In 2000
How To Trade A Taxing Market
Disclaimer: The information provided by us is for educational and informational purposes. This information is based on our trading experience and beliefs. The information on this website is not ...
more

