
Despite the strenuous actions of the central bank, inflation was reduced only slightly. However, this didn’t prevent the bulls from rushing to buy the dip.
In Denial
With gold, silver, mining stocks, and the S&P 500 attempting to recover from the Sep. 13 sell-off, the price action was relatively sleepy on Sep. 14. However, while many were spooked by the resiliency of the Consumer Price Index (CPI), the post-GFC crowds’ willingness to ‘buy the dip’ should have been its undoing.
For example, I’ve noted on numerous occasions that the consensus is more worried about missing a dovish pivot than suffering a major drawdown. As a result, they will panic buy on the slightest hope that the bull market can resume. In contrast, with unanchored inflation shifting the calculus, recency bias has clouded investors’ judgment. To explain, I wrote on May 25:
A decade of dovish pivots has left a generation of investors believing that the central bank is all talk and no action. However, with inflation at levels unseen in 40+ years, Powell is not out of ammunition, and the Fed pivot crowd should suffer profound disappointment as the drama unfolds.
The bottom line? We’ve officially entered the monetary version of The Boy Who Cried Wolf. With Fed officials running to the rescue each time the financial markets show signs of stress, investors are programmed to ignore their hawkish threats. However, while these post-GFC pivots occurred with inflation perched near 2%, investors are so steadfast in their belief that they ignore the climactic consequences of unanchored inflation.
To that point, with more of that behavior on display during the Sep. 13 rout, the lack of fear in the financial markets highlights why we’re likely far from a medium-term bottom.
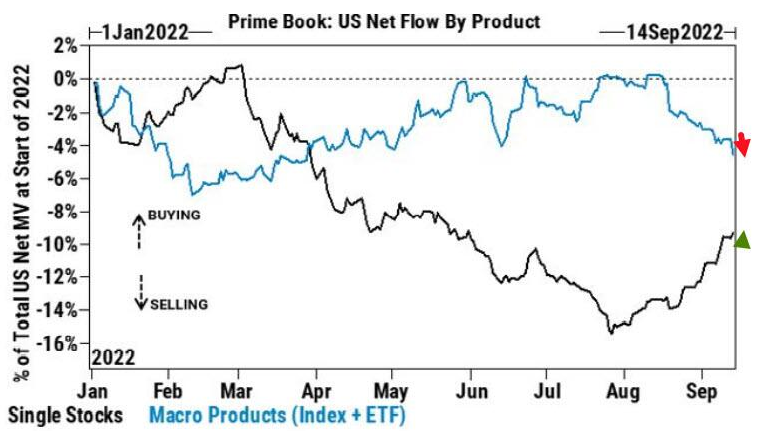
For example, Goldman Sachs Prime Brokerage data showed that while hedge funds were sellers of macro products (indexes and ETFs), they bought individual stocks. Furthermore, purchases of technology shares outnumbered sales 3.5 to 1, and tech has been net bought for 12 of the last 14 sessions.
Please see below:
Source: Goldman Sachs
To explain, the blue line above tracks hedge funds’ activity in macro products, while the black line above tracks their activity in single stocks. If you analyze the divergence, you can see that the latter has remained uplifted over the last month and a half.
Furthermore, with the liquidity beneficiaries (tech stocks) catching a bid, hedge funds still believe in the Fed’s ability to orchestrate a soft landing.
Please see below:
Source: Goldman Sachs
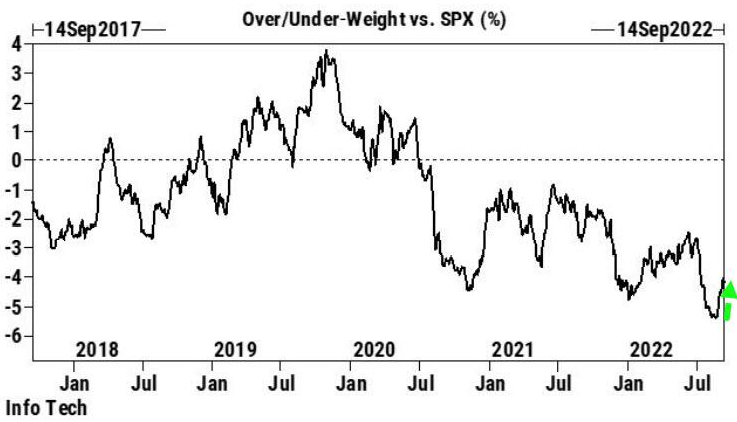
To explain, the black line above tracks hedge funds’ overweight/underweight of the technology sector relative to the S&P 500. If you analyze the right side of the chart, you can see that the black line has bounced off of its recent low, which implies that hedge funds are less bearish on the sector (though still underweight). As such, the sharp sell-off on Sep. 13 was nowhere near a capitulation.
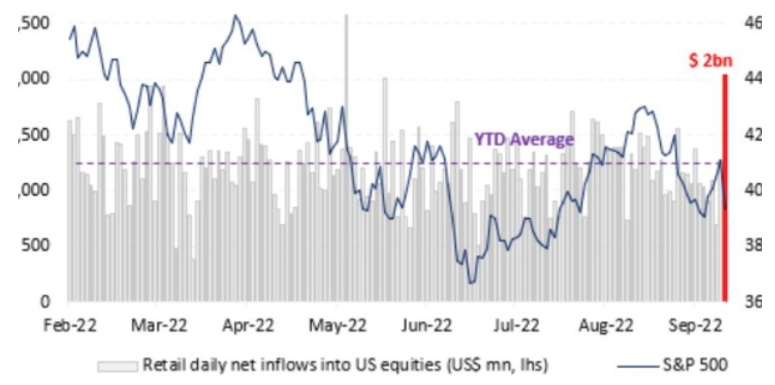
As further evidence, hedge funds weren’t the only ones eager to buy the dip. Data from Vanda Research shows that retail investors poured more than $2 billion into the market on Sep. 13, the second-largest daily net inflow in 2022.
Please see below:
Source: Vanda Research
To explain, the blue line above tracks the S&P 500, while the purple and red bars above track retail investors’ net inflows into U.S. equities. If you analyze the right side of the chart, you can see that the crowd went all in. Likewise, the $395 million that flowed into the SPY ETF was the largest one-day splurge since July 2021. As a result, no one fears inflation or the Fed.
However, Vanda Research analysts led by Marco Iachini noted how retail investors’ overconfidence may come back to bite them.
“Multiple capitulation indicators are now flashing a warning sign,” they wrote. “That means the likelihood of retail capitulation increases significantly near term should equities re-test this year’s June lows.”
Thus, with hedge funds and retail investors unconcerned about the troublesome fundamental backdrop, U.S. households are mirroring their complacency.
Please see below:
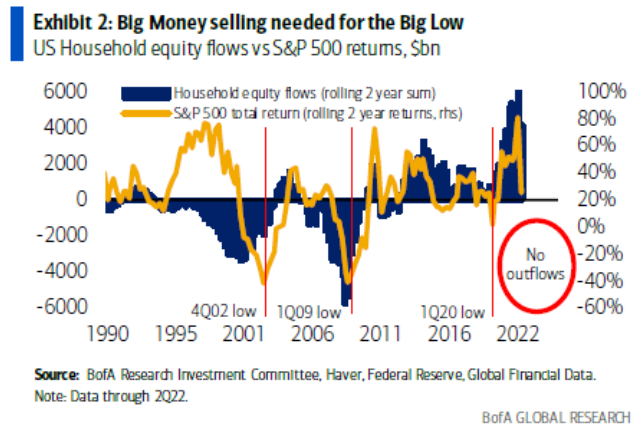
To explain, the gold line above tracks the S&P 500’s two-year rolling return, while the dark blue bars above track U.S. households’ rolling two-year equity flows. If you analyze the relationship, you can see that S&P 500 bottoms in 2002 and 2009 occurred after U.S. households rushed for the exits.
In contrast, the blue bars on the right side of the chart show how U.S. households are buying stocks, not selling them. Therefore, the post-GFC playbook has programmed investors to believe that the Fed can cure all economic ills.
Furthermore, while the 1970s/1980s recessions provided clear evidence of the destructive nature of inflation, the crowd has more faith in the Fed than in historical precedent or economic reality. However, the pivot proponents should suffer mightily as their soft landing hopes are derailed by inflation.
Speaking of which, I’ve been warning since 2021 that investors materially underestimate the inflation fight that confronts the Fed. Moreover, while consensus expectations continue to move in a hawkish direction, the medium-term economic ramifications are far from priced in.
Please see below:
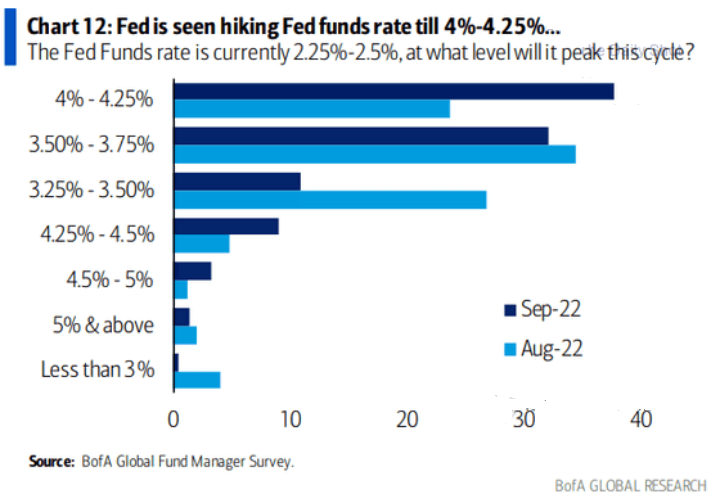
To explain, Bank of America’s latest Global Fund Manager Survey shows that most respondents expected the U.S. federal funds rate (FFR) to peak between 3.25% and 3.75% in August (the light blue bars). Conversely, September’s results show that the top spot is now in the 4% to 4.25% range (the dark blue bar).
As a result, what a difference a month makes. Yet, while rate hike expectations have moved materially higher, notice how the 4.5% to 5% and the 5% and above rows are in the major minority. In reality, these are the most likely outcomes. With an FFR in the 4.5% to 5.5% range needed to cool inflation, investors still underestimate the task at hand.
In addition, since it didn’t take long for the ~3.5% camp to jump to 4%+, don’t be surprised if these expectations ratchet higher in the months ahead.
The Real Deal
While the financial markets are eager to ignore the dilemma, Goldman Sachs’ Financial Conditions Index (FCI) continues to make higher highs and higher lows. For context, the chart below is inverted, which means that a lower black line results in tighter financial conditions.
Please see below:
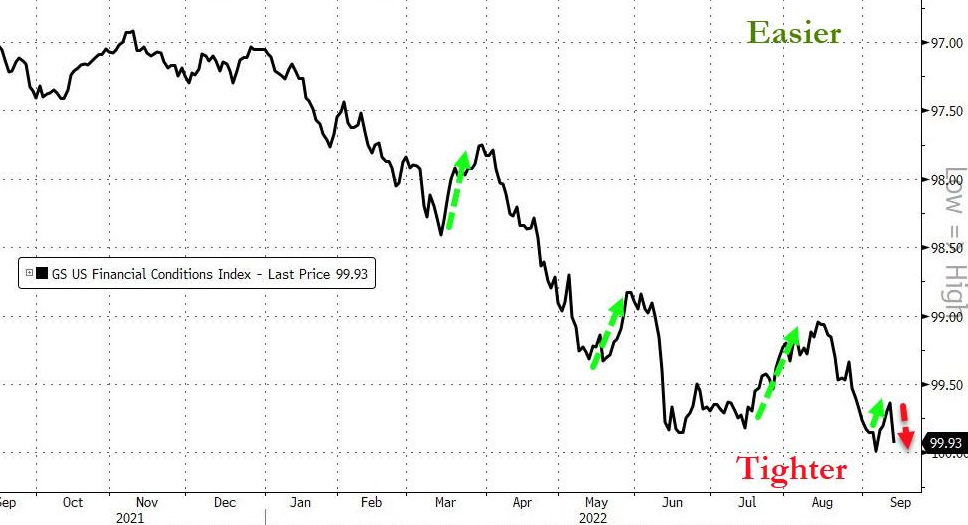
Source: Bloomberg/ZeroHedge
To explain, the Fed needs a lower black line to reduce inflation. Moreover, while tighter financial conditions are bearish for growth and risk assets, the post-GFC crowd assumes that once inflation dies, all of this will reverse and the bull market can resume. Therefore, not selling is the consensus strategy to front-run a dovish pivot.
However, the gambit is unrealistic because this mindset will prolong inflation. As long as investors brace for a dovish pivot, their bullish expectations will keep the Fed from achieving its goal. As such, continued denial will only make the Fed's job harder and result in a higher FFR over the medium term.
Likewise, investors' unwillingness to let the S&P 500 fall substantially is another reason why the Fed will need to work overtime to tame inflation.
Please see below:
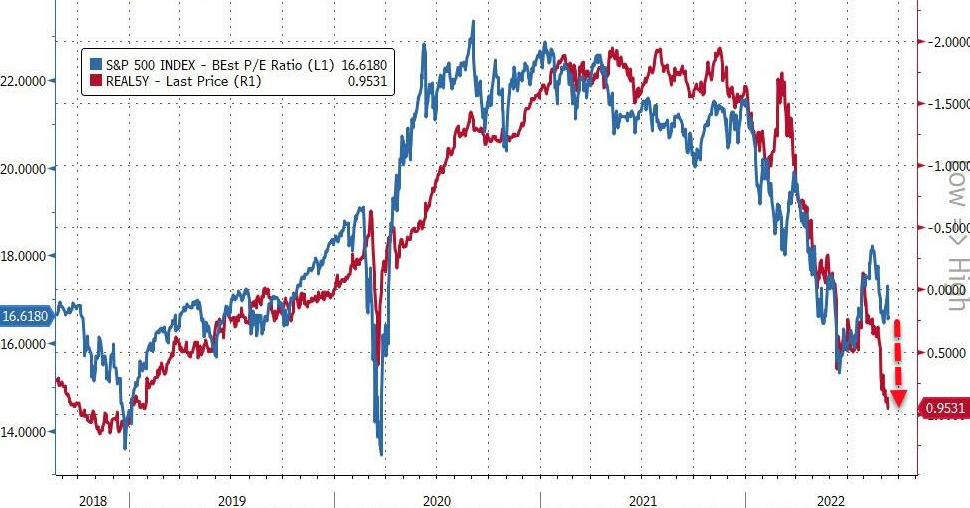
Source: Bloomberg/ZeroHedge
To explain, the blue line above tracks the S&P 500's forward price-to-earnings (P/E) ratio, while the red line above tracks the inverted (down means up) U.S. 5-Year real yield. If you analyze the gap on the right side of the chart, you can see that a higher U.S. 5-Year real yield has not been able to reduce the S&P 500's forward P/E recently.
However, this will only hurt investors in the long run. If asset prices decline sharply, the flow-through of lower commodity prices will assist in the Fed's inflation flight. However, with the financial markets unwilling to help, the Fed has to do the heavy lifting and push real yields even higher to achieve the desired results.
Overall, the Fed has a serious problem because the post-GFC crowd has been trained to hold and wait for the central bank's rescue. However, now, a sell-off would make the Fed's job easier. Yet, the Fed has created a monster, and the consensus mindset makes the central bank's job much harder. As a result, inflation should remain problematic and the FFR should continue its ascent until the financial markets reach a breaking point.
The Bottom Line
The dip buyers were out in full force as old habits die hard. However, despite their enthusiasm, only a little progress has been made on inflation. Moreover, the core CPI continues to increase even though the metric is least affected by supply-chain disruptions. Furthermore, prior Fed committees had to push the FFR above or within ~50 basis points of the peak headline CPI to curb inflation. Yet, is this time different? Either way, market participants drastically underestimate the challenges that lie ahead.
In conclusion, the PMs were mixed on Sep. 14, as gold ended the day in the red. However, while I’ve warned repeatedly that the bulls will likely buy the dip until the very end, a strong USD Index and higher real yields are profoundly bearish for financial assets. In addition, the sharp ascents of both have only reduced inflation by a small amount. As such, higher highs for the pair should be on the horizon, and gold, silver, mining stocks, and the S&P 500 should head in the opposite direction.
More By This Author:
Let’s Go Back To 2013 And Take A Look At The GDXJ Bearish CluesSilver's Signature Trick: Soaring, Although It Means No Good
The USD Fell On Ukraine’s Success News; How Did Gold React?


Comments
Log in or sign up to join the conversation.