
Disney Stock Valuation Part 1: Valuing Disney's Media Business
Sum-of-the-parts ("SOTP") or "break-up" analysis suggests that Walt Disney (NYSE:DIS) stock price has 39% potential upside. This value is hidden within the five major segments.
In spite of having $155 billion in market cap, Disney has continued to move the needle (228.71% stock price appreciation and 27% y/y average dividends growth rate in the last 10-years). Disney has managed to become a disruptor (33% stake in Hulu & starting DisneyLife) and a benefactor of traditional media by creating great content, making accretive acquisitions, investing and partnering with disruptive companies such as Netflix and Amazon.

In addition, Disney has a significant brand equity and owns a portfolio of lucrative, cash-generating Intellectual Properties ("IP"). It also has a seasoned management team with a lot of skin in the game with the CEO owning 475,082 shares. Outside of their core business, Disney also has a small real estate empire - with a land mass in acres larger than Manhattan and 17% of San Francisco. The value of assets greatly improves when you include the value of its attractions, IP, buildings and equipment.
The surprising part about Disney is that the stock has more than enough coverage. However, the underlying value of its businesses is highly undervalued. This undervaluation is a function of Disney's scale. Scale has negatively affected Disney's valuation mainly because investors only focus on a tiny aspect of one segment (last year it was ESPN) and because assigning industry multiples to Disney is misleading. It is misleading because of the diverse nature of its business segments.
Estimated 2016 EPS fair value
Disney's 5-year revenue growth rate was used to estimate the stock's fair value for 2016. The fair value was then broken down by segment. Each segment was then assigned an EPS estimate based on its revenue contribution to Disney's total revenues.
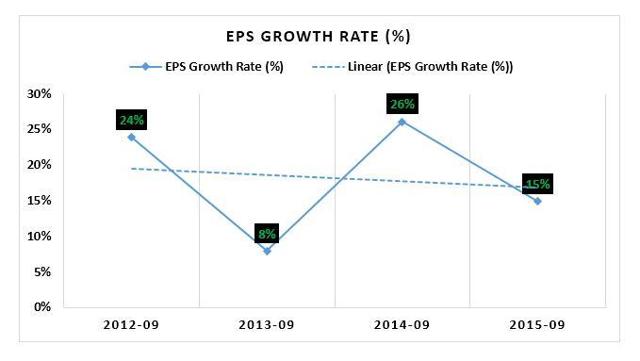
Disney's 5-year average annual EPS growth is 18%. The company had EPS of $4.95 for FY end 2015. Using the 18%, projected 2016 EPS is $5.84. This is a reasonable estimate because Yahoo! Finance has Disney's TTM EPS of $5.47.
Graph 1 shows Disney's y/y EPS growth rates between 2011-2015. Data was derived from Morningstar and graphed as shown below.
Estimated 2016 segment EPS estimates
This section assigns a rough EPS estimate for 2016 to each of Disney's segments based on that segments' sales contribution as shown below.
REFERENCE TABLE: Table showing each of Disney's segments 5-year average revenue growth, % contribution to sales, estimated 2016 EPS)
(Click on image to enlarge)

MEDIA NETWORKS - Accounts for 44% of TR (total revenue)
Overview - segments that make up Disney's Media Networks segment
Media Networks accounts for 44% of revenues and include;
- Cable networks - ESPN (80% owned), Disney Channels (100% owned), ABC Family (100% owned), A&E Television Networks (50% owned), the Hungama (kids entertainment featuring anime, Hindi-language series and game shows) and UTV/Bindass networks in India.
- Broadcasting - Domestic broadcast network, television production and distribution operations, and eight owned domestic television stations. This segment has two major great investments: 33% stake in Hulu and 50% stake in Fusion.
- Other segments include television production operations, television distribution, domestic television stations and radio networks and stations.
Estimating Media Networks fair value
Media Networks can be a huge standalone business with $23.264 billion in annual revenues, almost half the annual revenues from Time Warner and Twenty-First Century Fox and with 43% higher revenues than Viacom. The P/E ratios for competitors are: forward 2016 P/E of 9.15 for Viacom -B (NSDQ:VIAB), 12.93 for Time Warner (NYSE:TWX) and 14.29 for Twenty-First Century Fox. Using 2016 EPS of $2.59 for Disney's Media Networks and capitalizing at 9.15x, 12.93x and 14.29x, we get values of $23.70, $33.49 and $37.01 respectively.
Evaluating fair value results
But the most likely range is $33.49-$37.01 and here is why. Back on April 21, 1995, Capital Cities/ABC closed trading at $84.50/share. That is larger than the top range above. Accounting for inflation that is equivalent to $133.20/share today.
This is important because back in 1995, Walt Disney acquired then Capital Cities/ABC Inc. for $19 billion, which was the second largest takeover in U.S. history at the time. Assuming that $19 billion did not increase in value and only taking into account inflation, ABC Family would be worth ~$30 billion today.
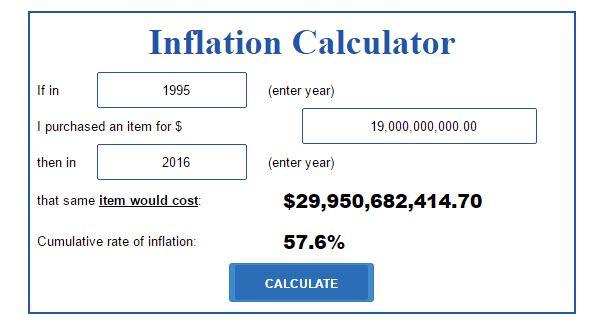
(Source: U.S. Inflation Calculator)
Looking at Capital Cities/ABC today with respect to revenues, it could have traded between Viacom and Time Warner/Fox. For example, Time Warner trades at $70.72/share and had sales of $28.12 billion in FY2015. Viacom trades at $40.97/share and had $13.27 billion in sales in FY2015. And Disney's Media Networks had $23.26 billion in sales in FY2015. It is possible that it could have been trading higher than Viacom but less than Time Warner. Implying a fair value somewhere between $18 billion (Viacom's market cap) and $61 billion (Time Warner market capitalization).
Finally, although we cannot infer a fair value stock price range for Disney's Media Networks based on Viacom and Time Warner stock prices of $40.97/share and $70.72/share , respectively, we know that Cities/ABC was trading at $84.50/share 20-years ago. What we know is that ABC is now part of the big three television networks, ESPN is now better, valuable and bigger than it was 20-years, and the 33% stake in Hulu will keep rising in value as consumer media consumption continues to evolve. All these factors make it likely that the $37.01/share projection is a fair estimate, albeit very low.
Estimate risks
The post-acquisition value for Capital Cities/ABC should be more than $30 billion or greater than $37.01/share as shown above. In addition, calculations above do not take into account post-acquisition synergies. These might include margin expansion as different segments collaborate and streamline. Such an omission could cause a lower estimate given that companies with higher margins tend to trade higher.
Also, increased competition can depress margins moving forward. For example, the growth in the number of networks distributed by MVPDs has resulted in increased competition for advertising revenues both in the broadcast and cable networks.
Furthermore, Media Network is also facing higher acquisition costs for sports and other live programming. New entrants (Facebook, Twitter) have intensified competition causing future live content acquisition more expensive over time.
Conclusion
This was the first part of a two series break-up analysis of Disney. It is a testament to the company's hidden value and a new way of looking at Disney as a value play.
The second and last article (Part 2) in the series will further breakdown Disney's other segments, explain why there is a disjoint between Disney's current stock price and underlying economics. Giving a clear picture as to why this opportunity exists.
Disclosure: I do not hold any positions in the stocks mentioned in this post and don't intend to initiate a position in the next 72 hours. I am not an ...
more
Comments
 No Thumbs up yet!

