
Disney (DIS) shares slipped almost 5% in after-hours trading last night following results that fell short of expectations in several key areas, including total revenue and earnings per share (EPS). However, Disney+ and the Parks, Experiences and Products division will take most of the headlines.
-min_(1)-1.jpg)
The Disney streaming service - Disney+, which thrived whilst other revenue sources floundered during the pandemic – reported a significant slowdown in subscription growth during the quarter. But this slowdown should come as little surprise. At the beginning of the week, the news that Disney was offering new and certain returning subscribers in the US and other countries a month of Disney+ for just $1.99 (usually $7.99 in the US), revealed their concern about a lack of growth in this part of the business.
The reopening of economies around the world means that Disney+ now finds itself not only facing competition from other streaming services, but also from in-person entertainment sources.
Elsewhere, Disney’s Parks, Experiences and Products division provided a welcome boost in revenue, coming in above analysts’ expectations at $5.45 billion for the quarter, an increase of almost 100% year-on-year (YOY).
However, operating income from this division fell short of forecasts at $640 million, which Disney blamed on increased costs largely due to the implementation of Covid-19 safety measures. Despite operating income not meeting analysts’ expectations, it is worth noting that in the same quarter last year, Disney reported a loss of $945 million.
These results highlight some of the key problems still facing Disney due to the pandemic and the resultant uncertainty could see Disney’s share price fall further in the coming sessions.
However, looking forward, Disney will be confident that new streaming content scheduled for release in 2022 will help boost subscriptions. Furthermore, the reopening of US borders to European tourists is likely to provide a boost to theme park and resort revenue for the current quarter.
(Click on image to enlarge)
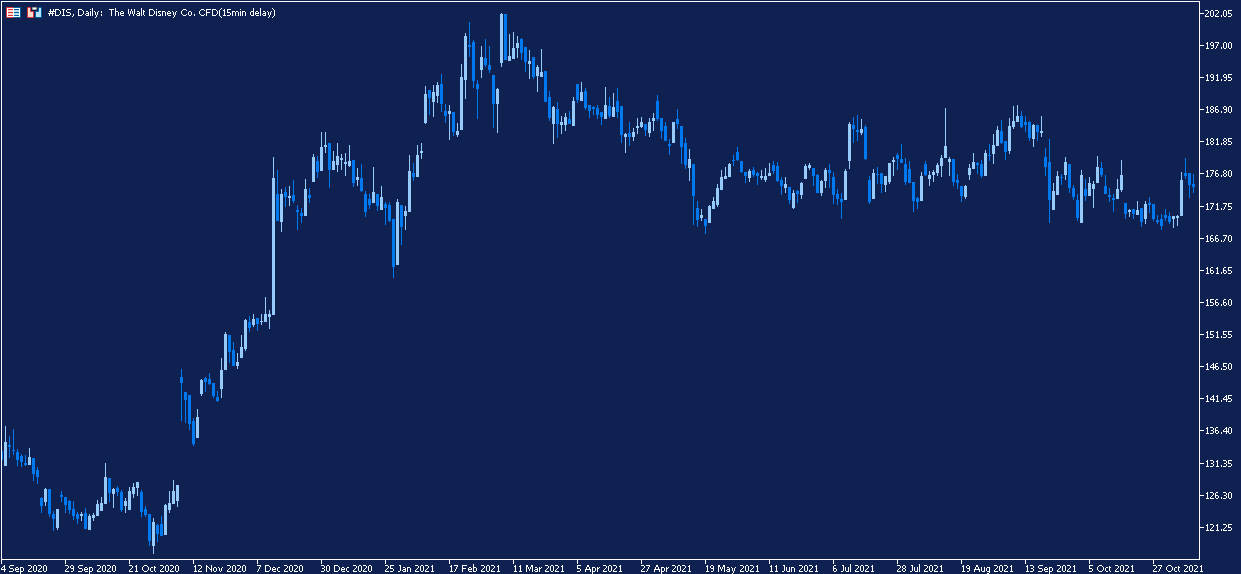
Depicted: Admirals MetaTrader 5 – The Walt Disney Co. Daily Chart. Date Range: 4 September 2020 – 10 November 2021. Date Captured: 11 November 2021. Past performance is not a reliable indicator of future results.
Five year evolution of the Disney share price:
- 2020 = +25.51%
- 2019 = +31.97%
- 2018 = +1.39%
- 2017 = +3.80%
- 2016 = -1.94%


Comments
Log in or sign up to join the conversation.