
Difference Between Operating Leverage And Economies Of Scale
“Do you know the difference between operating leverage and economies of scale? Seriously, take a moment to define the terms clearly (I did not know the difference for a long time and see investors use the terms interchangeably all of the time).” - Michael Mauboussin
What a great question, and honestly, how many of us understand the difference?
Many of us talk about a company growing revenues, which helps them achieve greater profitability through operating leverage. The revenue growth enables them to achieve higher levels of economies of scale.
Once we understand the interactions between sales growth and operating margins, we better will define the above ideas.
Shareholder value is driven by value triggers, value factors, and operating value. We can find many great companies by determining what drives operating leverage plus economies of scale.
Using the above structure can help us visualize what drives leverage and scale.
In today’s post, we will learn:
- What is Operating Leverage?
- What Are Economies of Scale?
- Operating Leverage vs. Economies of Scale
- Analyzing a Business Through Operating Leverage and Economies of Scale
Okay, let’s dive in and learn more about the difference between operating leverage and economies of scale.
What is Operating Leverage?
Operating leverage as defined by Investopedia:
“Operating leverage is a cost-accounting formula that measures the degree to which a firm or project can increase operating income by increasing revenue. A business that generates sales with a high gross margin and low variable costs has high operating leverage.”

An easy way to think about operating leverage relates to the software industry.
For example, Adobe (ADBE) does a fantastic job of illustrating operating leverage. Because of the nature of their business and use of subscriptions, Adobe can generate revenue growth from relatively low use of fixed assets.
Adobe has grown gross profit margins from 85% in 2013 to 87.7% in 2021.
The nature of how they have been able to do this lies in defining operating leverage.
Companies like Adobe, Salesforce, and Microsoft have high operating leverage. The operating leverage stems from a greater portion of fixed costs that remain unchanged from different production levels. In contrast, others with low operating leverage tend to have higher variable costs which fluctuate according to production levels.
- Fixed costs – we can think of fixed costs as costs already incurred and need to continue to pay regardless of sales growth or production volume.
- Variable costs – these costs will fluctuate based on a company’s sales performance. For example, Amazon’s delivery costs increase during the holiday season and lessen during slower sales cycles.
For example, Microsoft (MSFT) doesn’t see any change in costs to sell another unit of Word or Excel. They have already created those products, and it doesn’t cost them any additional costs to sell ten or ten thousand.
A company like Nike (NKE) has low fixed costs but higher variable costs associated with inventories. For Nike to sell higher numbers of Air Jordans, they need to purchase, upfront, more shoes. Those higher purchases increase their cost of goods sold, leading to lower operating leverage.
What Are Economies of Scale?
Economies of scale refer to the cost advantages a company experiences when it increases output.
Think of it like a teeter-totter; the advantage stems from the relationships between costs and quantity. For example, the greater quantity a company produces, the lower the costs. As the output increases, the fixed costs drop, and vice versa.
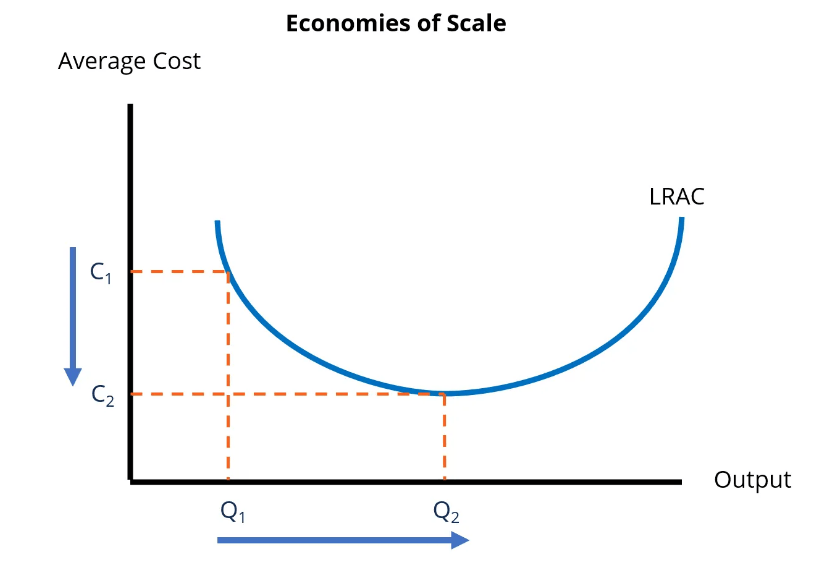
Graph courtesy of Corporate Finance Institute
Companies with operating efficiency can also experience economies of scale.
As these companies see a greater output, the variable costs fall in step. Companies can see economies of scale at any point along the production process. These benefits can occur at any stage in the creation path, from:
- Creating product
- Marketing
- R&D
- Sales
We can see economies of scale throughout the production path, from producing said widget to labor.
The big takeaway from economies of scale involves reducing fixed costs per unit. As a company increases production, it spreads the costs out over the total output.
Economies of scale have two types:
- Internal – these are economies of scale particular to each company. For example, ASML owns the patent on their EUV machines. These machines help produce semiconductor chips, and only they produce these machines.
- External – these economies of scale refer to the entire industry. For example, going back to the semiconductor industry, the recent passing of the Chips Act incentivizes those in the sector. It will spur them to invest more and give them advantages over other sectors for resources.
We can kind find three sources of economies of scale:
Purchasing – Companies like Amazon and Costco (COST) use their size and buying power to lower their average costs. For example, Costco can approach their vendors and buy large quantities of chickens for their roasted chickens. This helps them keep the costs low, which they pass on to the customer.
Technological – Companies in the auto industry have benefited from economies of scale over the years. By introducing new processes and technology to the production of cars, they could increase their output and drive down costs through cuts in labor.
Managerial – Danaher (DHR) and Constellation Software (CNSWF) manage their business through decentralized structures. These structures allow them to spread out decision-making and improve the talent they hire and develop from within.
However, economies of scale don’t all come with sunshine and rainbows. They can have downsides to them.
“The key to future profitability and success in the cable business will be the ability to control programming costs through the leverage of size.”
– John Malone
As a company grows, it typically grows in complexity, and the greater complexity can lead to higher costs. For example, Apple (AAPL) may want to boost iPhone sales by increasing marketing spending. But they might also need to hire more managers to oversee the increased production to meet demand.
These higher costs might offset the marketing spending and sales increases and drive up the overall costs.
Operating Leverage vs. Economies of Scale
The best way to think about operating leverage vs. economies scale is about sales growth.
We want to focus on the value factors which help drive sales growth:
- Volume
- Price
- Operating leverage
- Economies of scale
Our main focus is on operating leverage and economies of scale value factors.
The easiest way to determine operating leverage is through the following formula:
Operating leverage = % Change in EBIT / % Change in sales
- Where EBIT equals earnings before interest and taxes
To better understand these value factors’ impacts on sales, Michael Mauboussin created a great chart to help us visualize.
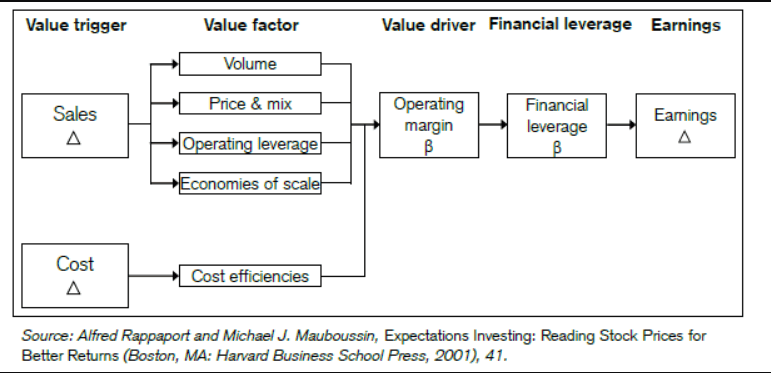
We can see from the above chart the impact both value factors have on sales and how we can interpret those impacts.
Let’s look at operating leverage first.
To generate sales and profits, every company needs to invest money before generating these sales. We can refer to these costs as “pre-production costs.” These costs can differ depending on the industry. For example, those in utility, telecom, and railroads have costs associated with physical spaces.
These companies capitalize the costs on their balance sheet and depreciate them over time on the income statement.
Other companies in the tech world, for example, make tremendous investments in R&D and marketing. These companies expense their costs on the income statement.
These pre-production costs can drive down operating margins in the short term. But as sales of the iPhone increase, the margins and profits also grow. The following example is an easy way to think about operating leverage and its impact.
Verizon spends billions in pre-production costs to build out its 5G network, all while the network grows sales at 2%. As the 5G network comes online, more and more users embrace higher internet speeds. The increased speeds attract more users, which helps drive up sales. The pre-production costs remain set, but the growing sales from the increased usage help improve margins.
We want to find companies spending on pre-production costs while having the ability to create operating leverage. These companies can leverage their pre-production costs to generate higher sales and margins.
Next up, we have economies of scale.
Companies enjoy economies of scale when they can increase sales while keeping fixed costs low. The key activities tied to economies of scale include:
- Purchasing
- Production
- R&D
- Sales
- Marketing
- Distribution
Economies of scale for companies like Adobe and Apple increase efficiencies as sales grow.
Here is the big difference between operating leverage and economies of scale.
**Operating leverage improves margin by spreading out fixed costs over higher sales. Economies of scale relate to improving efficiencies as sales grow.**
Most investors, including yours truly, have mistaken operating leverage for economies of scale, which can lead us to the wrong conclusion that costs will improve as the company tries to match demand.
Michael Mauboussin offers a fantastic example of economies of scale via Home Depot:
“The financial results of Home Depot, the largest home improvement retailer in the United States, are an example of economies of scale. Home Depot’s gross margins expanded from 27.7 percent in fiscal 1996 to 29.9 percent in fiscal 2001 as it added incremental sales in excess of $30 billion. The company attributed the improvement in its profitability to the ability to use its size to get better prices from its suppliers.”
Analyzing a Business Through Operating Leverage and Economies of Scale
The best way to analyze the impacts of both factors is to use an example. Consider that operating leverage refers to the relationship between fixed and variable costs.
Operating leverage remains highest in companies with a high proportion of fixed costs. In comparison, those with the lowest have lower levels of fixed costs.

For example, Microsoft carries higher fixed costs than Walmart (WMT), which gives Microsoft higher operating leverage.
Microsoft’s business model leads us to understand the bulk of their cost structure remains fixed. Most of Microsoft’s costs revolve around their pre-production costs. They spend most of their money on upfront R&D and marketing, and considering they created Office years ago, the costs were spread out over many years.
As Microsoft continues to grow, it can widen its operating margins.
So how exactly does operating leverage impact operating margins? Let’s use the following example.
Let’s assume Dave’s Wine Bar has sales of $100 million (we can dream) and an operating profit of $15 million. Let’s also assume the upfront or pre-production costs are $17 million, or 20% of the $85 million operating costs. No other upfront costs will incur, and operating costs will remain at 68%.
The chart below will lay out how operating leverage impacts our business.
|
2022 |
2023 |
2024 |
|
|
Sales |
$100 |
$110 |
$121 |
|
Pre-production costs |
$17 |
$17 |
$17 |
|
Operating expenses (68%) |
$68 |
$75 |
$82 |
|
Total operating costs |
$85 |
$92 |
$99 |
|
EBIT |
$15 |
$18 |
$22 |
|
EBIT Margin |
15% |
16% |
18% |
Our operating leverage increases the operating margin each year in our example. We can see how the margins improve the bottom line each year as the fixed costs remain the same.
One of the biggest fears surrounding Meta (META) right now revolves around how much operating leverage they can enact with the investments in R&D. As the company spends more and more on pre-production costs, the worry continues that Meta will never see the adoption of the metaverse.
One of the ways Dave’s Wine Bar can improve their economies of scale versus competitors is in the field of “swipe” fees or processing fees for card payments.
Each time a retailer accepts a card for payment, the processors and banks charge the retailer a small fee. These fees can add up to thousands or more each month, impacting the bottom line.
As a larger retailer than some small mom-and-pop wine bars, we can negotiate lower fees, which can help improve our bottom line.
Companies on a larger scale can negotiate better deals for many essential tasks, like purchasing, marketing, sales, customer service, and distribution.
One of the advantages Amazon (AMZN) has among the online marketplaces is the size and distribution network they have established; Shopify (SHOP) doesn’t have the scale or capacity to compete with Amazon on distribution costs.
They have to build their network, spending billions in the process, or utilize others to deliver for the company.
Because of its size, Amazon can negotiate better pricing on sales and marketing efforts than Shopify. If Amazon wants to promote Prime through the media channels, they can negotiate better pricing than others, giving them a better margin.
But pursuing market share and dominance doesn’t always lead to sunshine and rainbows. For example, during the Pandemic, Amazon experienced a huge spike in demand, and to meet that demand, they built many warehouses.
And in the wake of the Pandemic, demand decreased, leaving Amazon with lots of capacity but lessening demand. All of this put a strain on Amazon’s margins, leading to increased layoffs to reduce costs.
Investor Takeaway
Analyzing companies operating leverage and economies of scale will help tell you a lot about a company and its future profitability.
While these two factors don’t tell the whole story, they can help fill in the blanks along with helping us think a little deeper about what drives the numbers on the financial statements.
Remember the big difference between operating leverage and economies of scale:
**Operating leverage improves margin by spreading out fixed costs over higher sales. Economies of scale relate to improving efficiencies as sales grow.**
If you take away nothing else from this post, remember the above phrase.
If you want to learn more about these fascinating subjects, I recommend the following resources from Michael Mauboussin:
Operating Leverage: A Framework for Anticipating Changes in Earnings
And with that, we will wrap up today’s discussion.Until next time, take care and be safe out there,
Sources
More on economies of scale
More By This Author:
Bird’s Eye View of Walmart
Analyzing Intangible Assets and Their Impact To Assets and Operating Income
How To Research Stocks (For Beginners)
Disclosure: Intrinsic Value Formula is published as an information service. It includes opinions as to buying, selling and holding various stocks and other securities. However, the publishers of ...
more

