
Did The Stock Bubble Just Pop?
It has been 18 months since I closed Best Minds Inc. Today I am teaching math. I love math because even when opinions appear totally wrong, math is still based on proofs.
So let’s prove that we are in a massive financial bubble that today, may have finally popped, even with all the “help” from central planners of market manipulation.
(Click on image to enlarge)
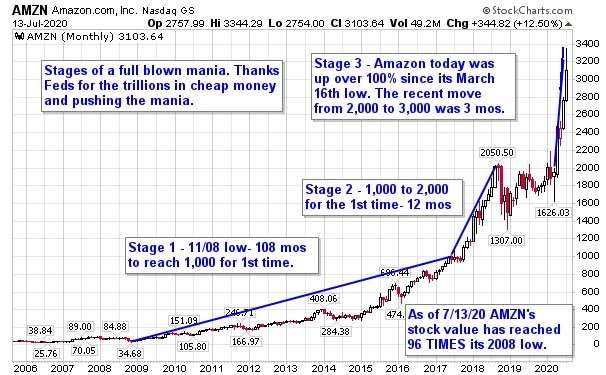
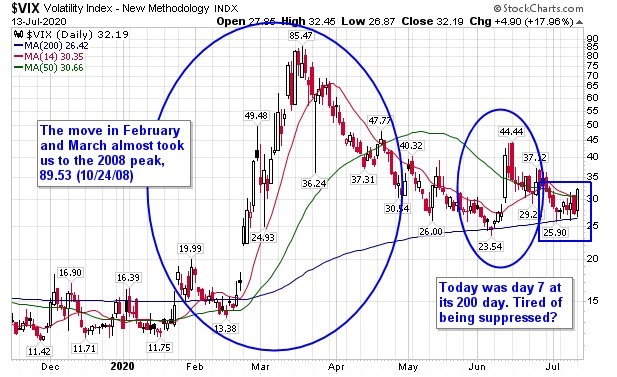
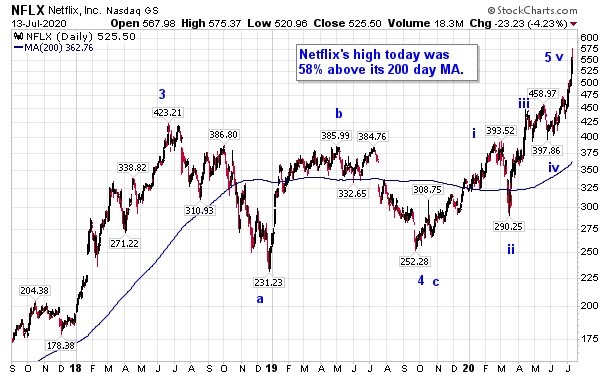
Exhibit 1 – The faster a stock or market rises, the more it produces a parabola. Parabolic spikes have been warnings signs repeatedly. History has been here before, and the outcome was not “more sunny skies ahead”.
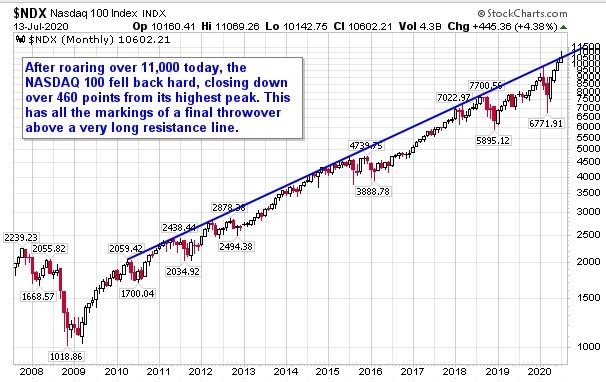
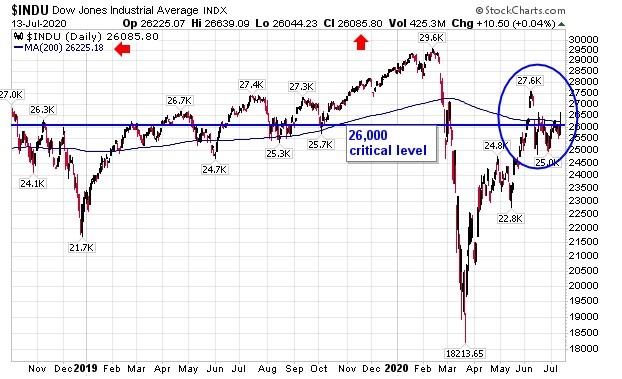
Exhibit 2 – For every action there is an equal and opposite reaction – 3rd law of thermodynamics
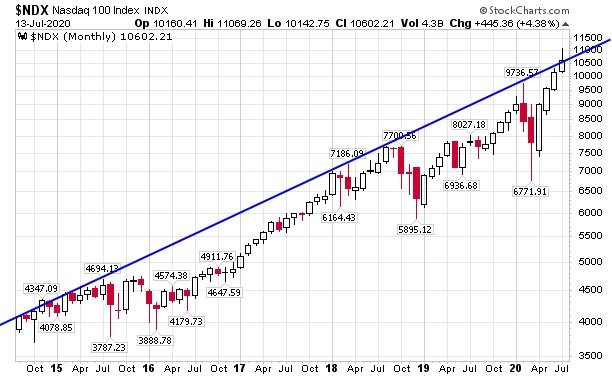
We can see from the two charts below that there has been a resistance level for 10 years in the Nasdaq 100. We have arrived at this level several times since 2010. Every time we slowed or stalled. However, the Nasdaq 100 burst through this line last week. Was this a sign of extreme exuberance and market “assistance”, or merely savvy investors who understand that economic news since March is not important anymore?
(Click on image to enlarge)
(Click on image to enlarge)
Beyond these two exhibits, I would like to share some other warning signs.
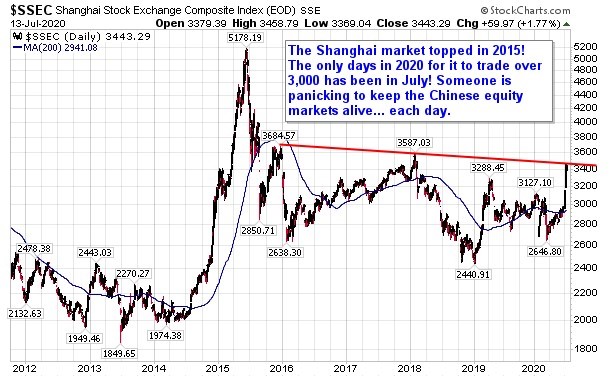
We can see from the chart below that the Nasdaq is the only one of these major equity markets that is in double digits this year. Shanghai is too, but only because of July. I am leaving this chart that I developed this weekend since today’s closing numbers were below these from Friday.
(Click on image to enlarge)
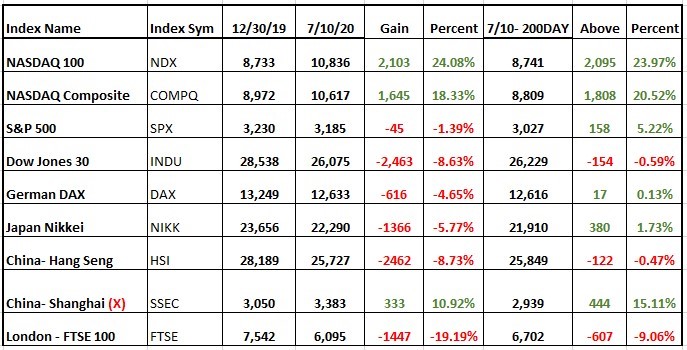
The Shanghai Stock Index was below its 3,000 mark at the close of June, so all its annual gain came in the last 2 weeks! Ready to dive in?
(Click on image to enlarge)
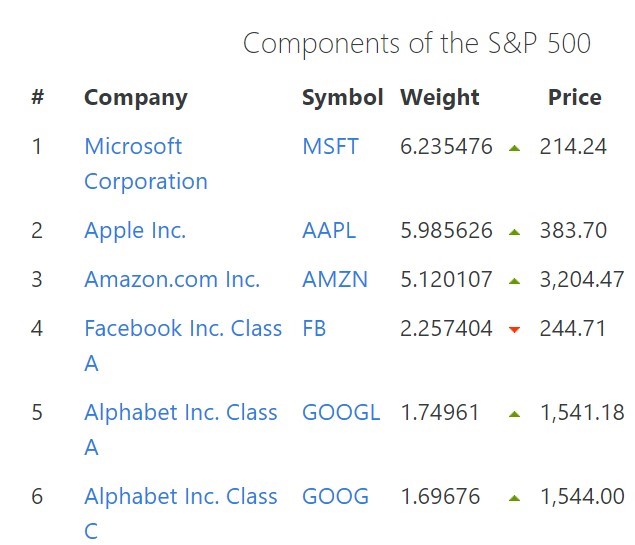
Next is the problem with extreme crowding as the top holdings in the Nasdaq 100 and S&P 500 reveal.
(Click on image to enlarge)
(Click on image to enlarge)
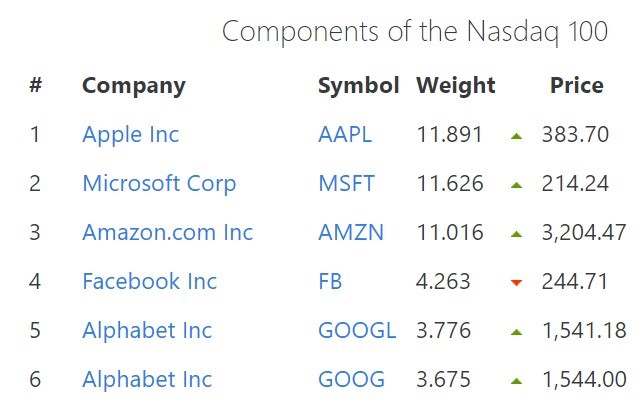
Millions of investors in index funds based on the performance of the S&P 500 and the Nasdaq 100 are heavily dependent on these same 5 companies. For S&P 500 investors this is almost one-fourth of their money. For NDX 100 investors this is close to one half of their money. Since these are two of the most traded indices in the world, it appears that global financial markets are heavily dependent on their recent performance continuing into the indefinite future.
500 years of market history reveal that every cheap money bull market has been followed by a serious bear market. Every major US market will be 2 years longer than any of their past bull markets in American history if they make it until September.
However, one thing is for sure. We are depending on a few global tech giants to keep up the illusion that economic pain for main street does not need to impact investors.
(Click on image to enlarge)
(Click on image to enlarge)
But is that smart for investors as we come through so many painful headlines this year?
(Click on image to enlarge)
Can the millions of investors who have come to spout the religious mantra, “It always comes back”, continue depending on even more debt from central banks to push their statement values higher? Not if gravity still exists and history is still relevant.
Best Minds, Inc is a registered investment advisor that looks to the best minds in the world of finance and economics to seek a direction for our clients. To be a true advocate to our clients, we ...
more


Very informative! When do you think the returns are going to start to reflect the reality of the situation, and not be based on optimism?
Good read, thanks.