
Deutsche Bank Stock Nesting Before Acceleration

Image Source: Unsplash
Deutsche Bank (DB) is a German multinational investment bank and financial services provider. It is one of the nine bulge bracket banks. Deutsche Bank is the largest German banking institution and is a part of the DAX-40 index. Founded in 1869 and headquartered in Frankfurt, Germany, it can be traded under tickers $DBK in Frankfurt and $DB at New York Exchange. After reaching the all-time highs in May 2007 at 86.23, the stock price lost more than 95% by March 2020. In the initial article from August 2021, we saw Deutsche Bank turning higher. We were right. Now, we see nesting price action. Soon, acceleration higher should take place. In the current article, we explain the wave structure of $DBK and the targets.
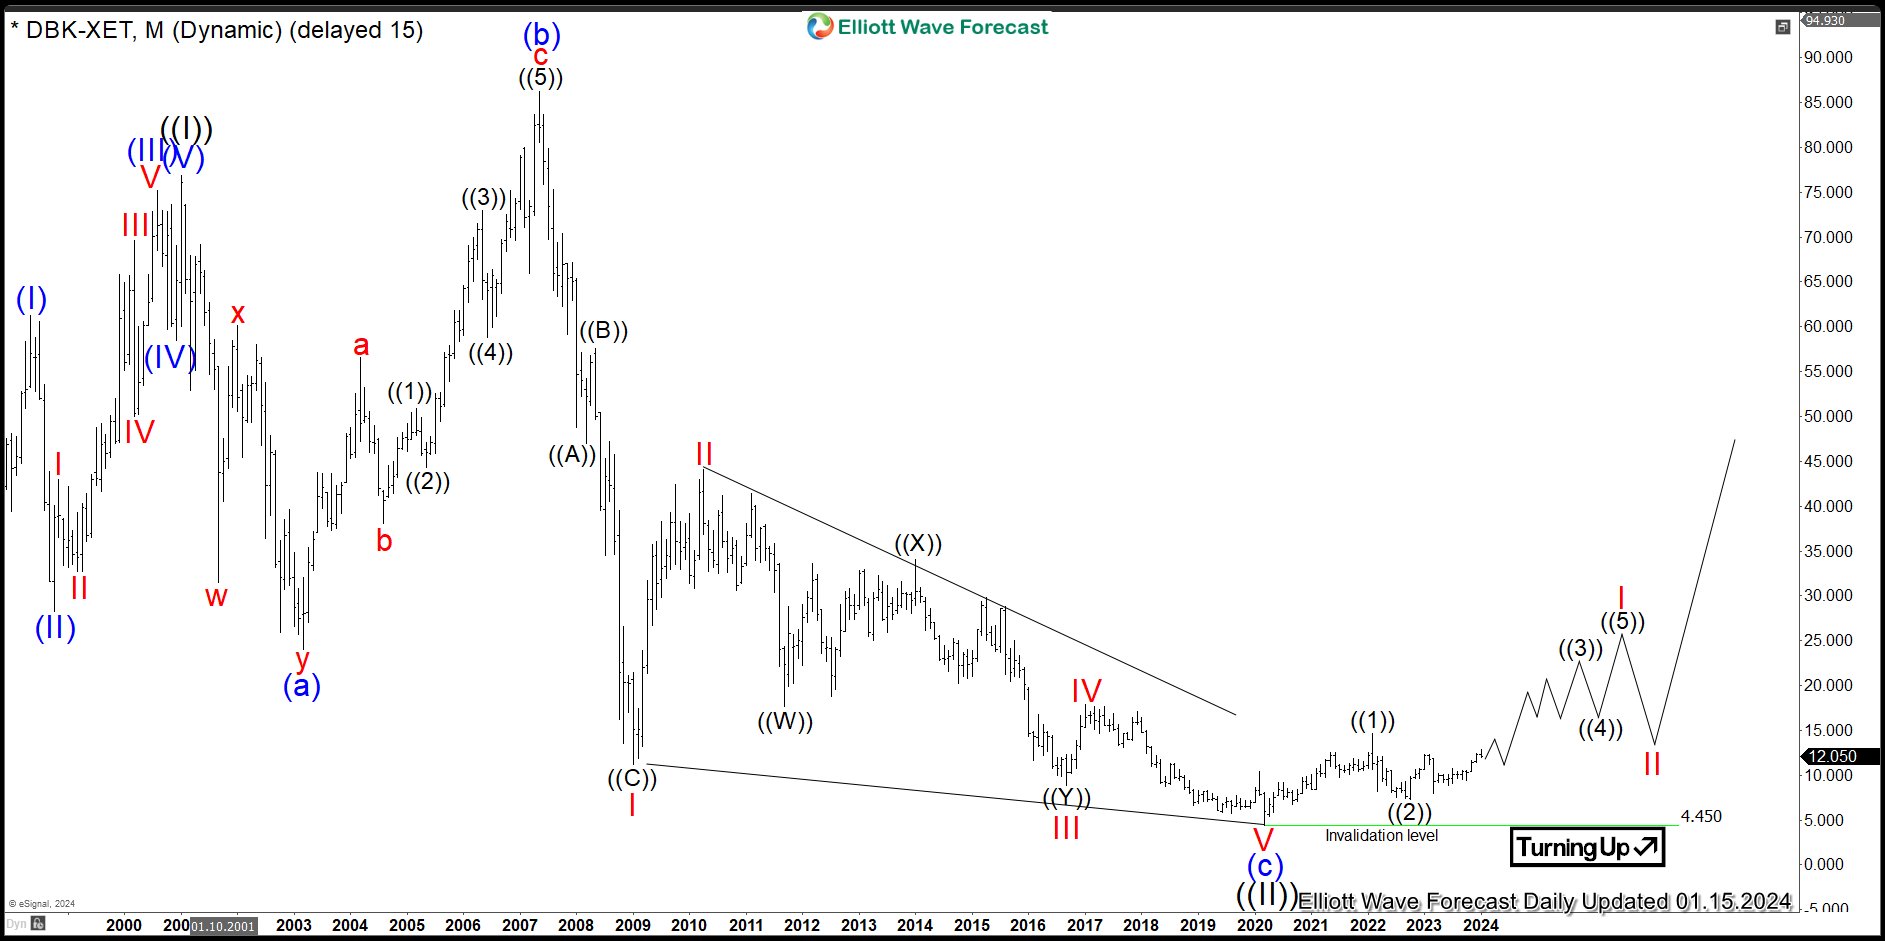
Deutsche Bank Monthly Elliott Wave Analysis 01.19.2024
The monthly chart below shows the Deutsche Bank stock $DBK traded at XETRA in Frankfurt. From the lows, the stock price has developed a cycle higher in wave ((I)) of a grand super cycle degree. It ended at 76.87 in January 2001. From there, a correction lower in wave ((II)) has developed an expanded flat Elliott wave pattern. Hereby, expanded flats are 3-3-5 structures which do a new high in price. First, from January 2001 highs, a first leg lower has ended in 3 swings at 23.99 in March 2003. Then, the second leg higher in 3 swings printed the all-time highs at 86.23 in May 2007. Finally, the last leg lower shows an ending diagonal which is an Elliott Wave 3-3-3-3-3 structure.
Hence, Deutsche Bank may have ended correction in wave ((II)) in March 2020 at 4.45 lows. While above, a new cycle in black wave ((III)) is in the first stages and should reach towards the new all-time highs. The target for wave ((III)) will be 81.41-128.93 area and even higher.
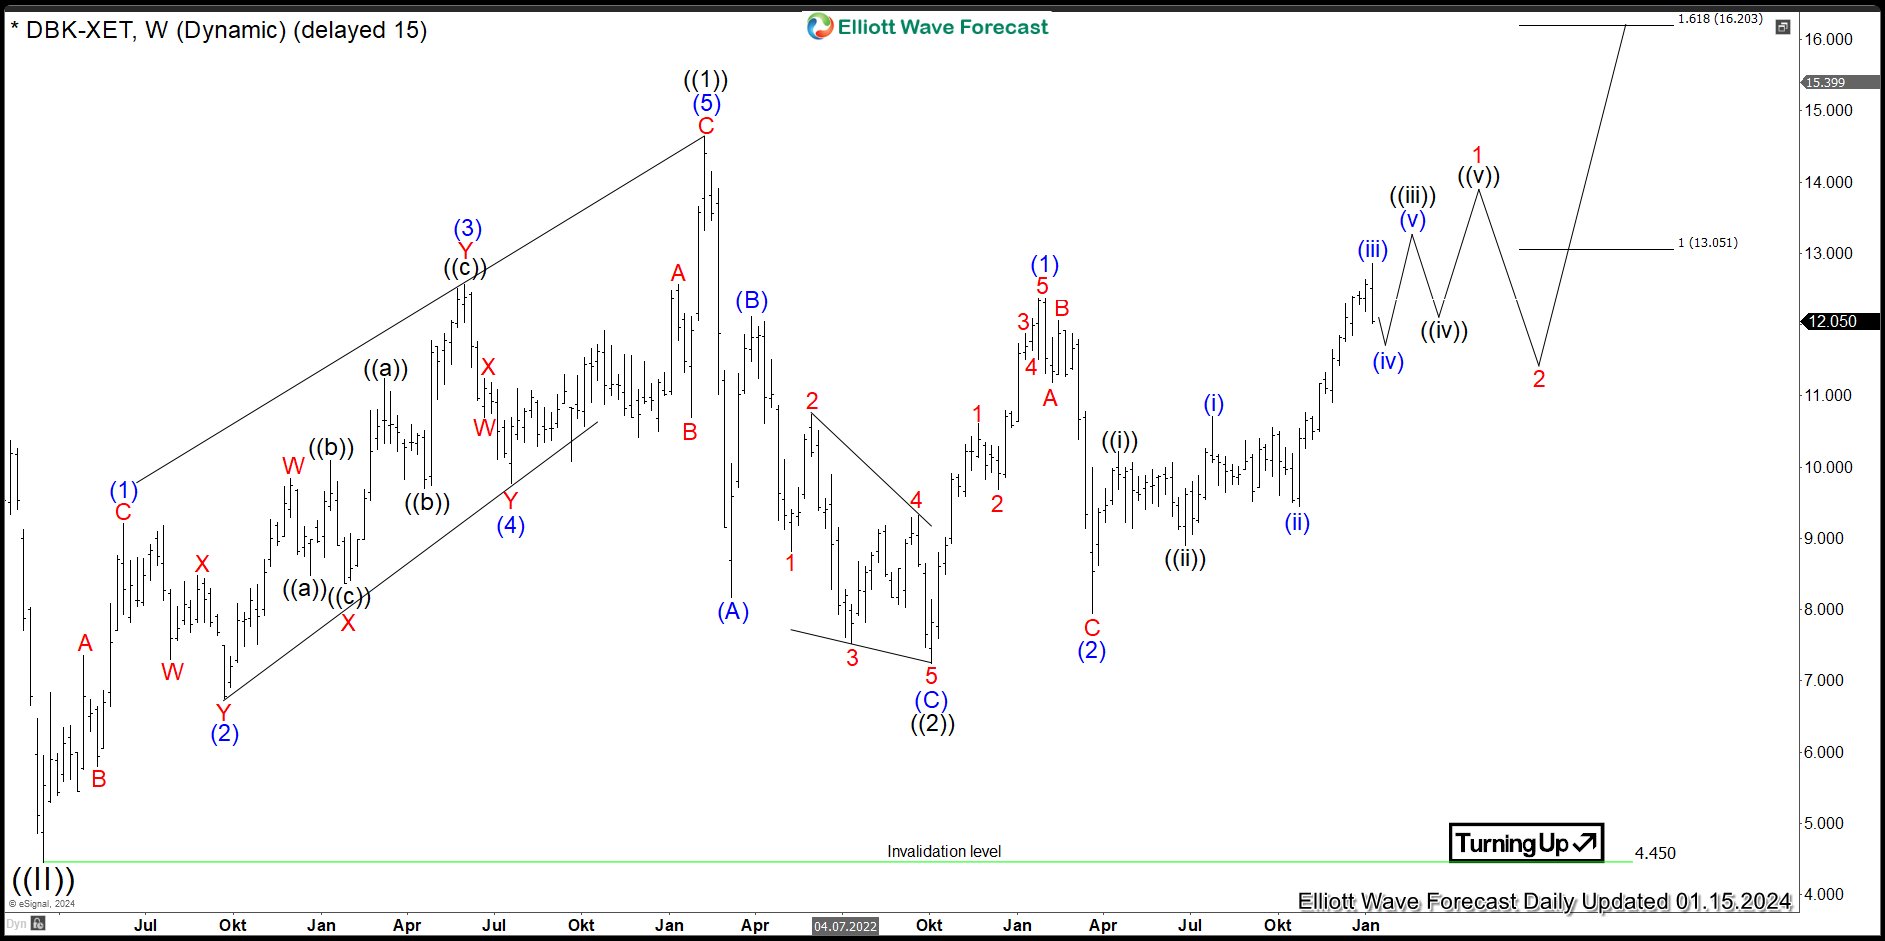
Deutsche Bank Daily Elliott Wave Analysis 01.19.2024
The daily chart below shows the nesting price action in black waves ((1))-((2)) and blue waves (1)-(2) of black wave ((3)) of red wave I from the March 2020 lows. Firstly, a leading diagonal in black wave ((1)) has ended in February 2022 at €14.64. Within it, the structure is 3-3-3-3-3 pattern. Secondly, a pullback in black wave ((2)) has set a bottom in October 2022 at €7.25 lows. From the lows, new cycle in black wave ((3)) might have started. Break of the February 2022 highs will confirm that. The target will be 17.45-23.76 area and even higher.
In shorter cycles, initial nest in blue waves (1)-(2) of black wave ((3)) has ended in March 2023 at €7.95 lows. While above there, blue wave (3) of black wave ((3)) is in progress. The target is 13.05-16.20 area and beyond. Investors and traders can be waiting for red wave 1 to end first. Then, they can buy the red wave 2 pullback in 3, 7 swings against March 2023 lows for an acceleration higher in red wave 3 of blue wave (3) of black wave ((3)).
More By This Author:
ServiceNow Riding the Wave of Cloud ComputingMicrosoft Should Remain Supported
Russell 2000 Rally Should Fail For More Downside
Disclaimer: Futures, options, and over the counter foreign exchange products may involve substantial risk and may not be suitable for all investors. Leverage can work against you as well as for ...
more

