
Delta And Southwest Airlines Fly Higher: A Look At The Charts For Each Stock

Photo by Jan Rosolino on Unsplash
Delta Air Lines Inc. DAL and Southwest Airlines Co. LUV are two airline stocks pushing higher Thursday. Stocks are pushing higher after Dr. Anthony Fauci said that you don't have to change holiday plans due to the COVID-19 variant omicron if you are vaccinated.
Delta was up 8.95% at $36.53 and Southwest was up 6.37% at $45.26 Thursday afternoon at publication.
(Click on image to enlarge)
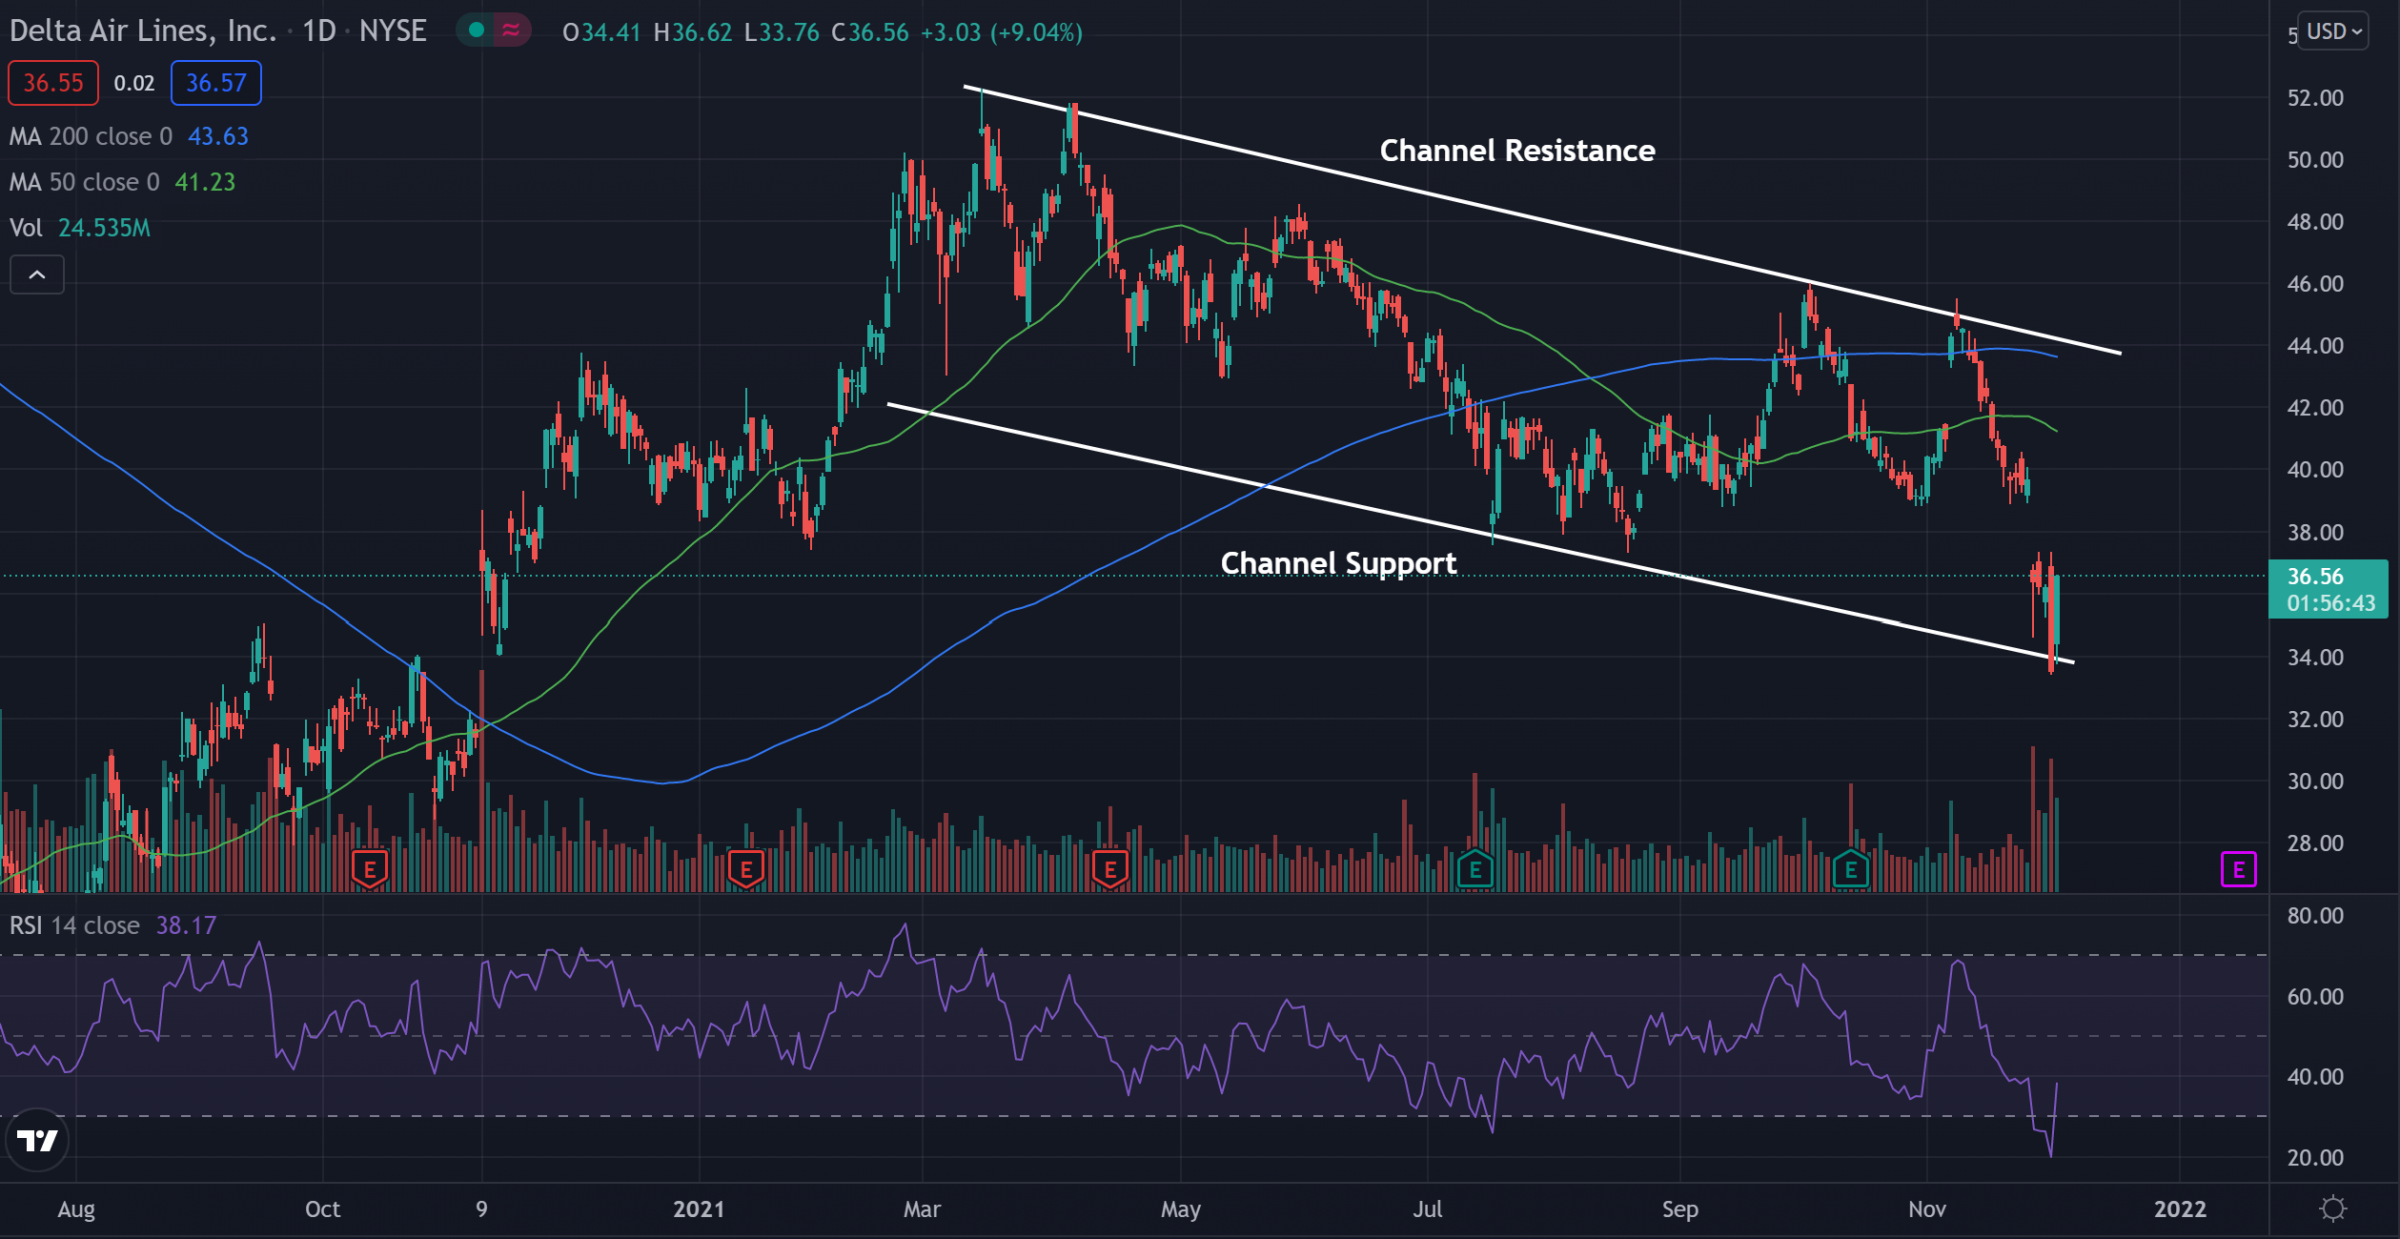
Delta Daily Chart Analysis
- Shares look to have recently bounced off support in what technical traders call a downward trending channel.
- Connecting highs and lows of the chart show the stock has been bouncing back and forth between two downward sloping parallel lines. These lines may continue to hold as support and resistance in the future.
- The stock is trading below both the 50-day moving average (green) and the 200-day moving average (blue), indicating sentiment has been bearish. These averages may hold as resistance in the future.
- The Relative Strength Index (RSI) was falling steeply for a time, but looks to have made a jump back higher pushing back up to 36. This shows some buyers have reentered into the stock, but selling pressure still heavily outweighs the buying pressure.
(Click on image to enlarge)
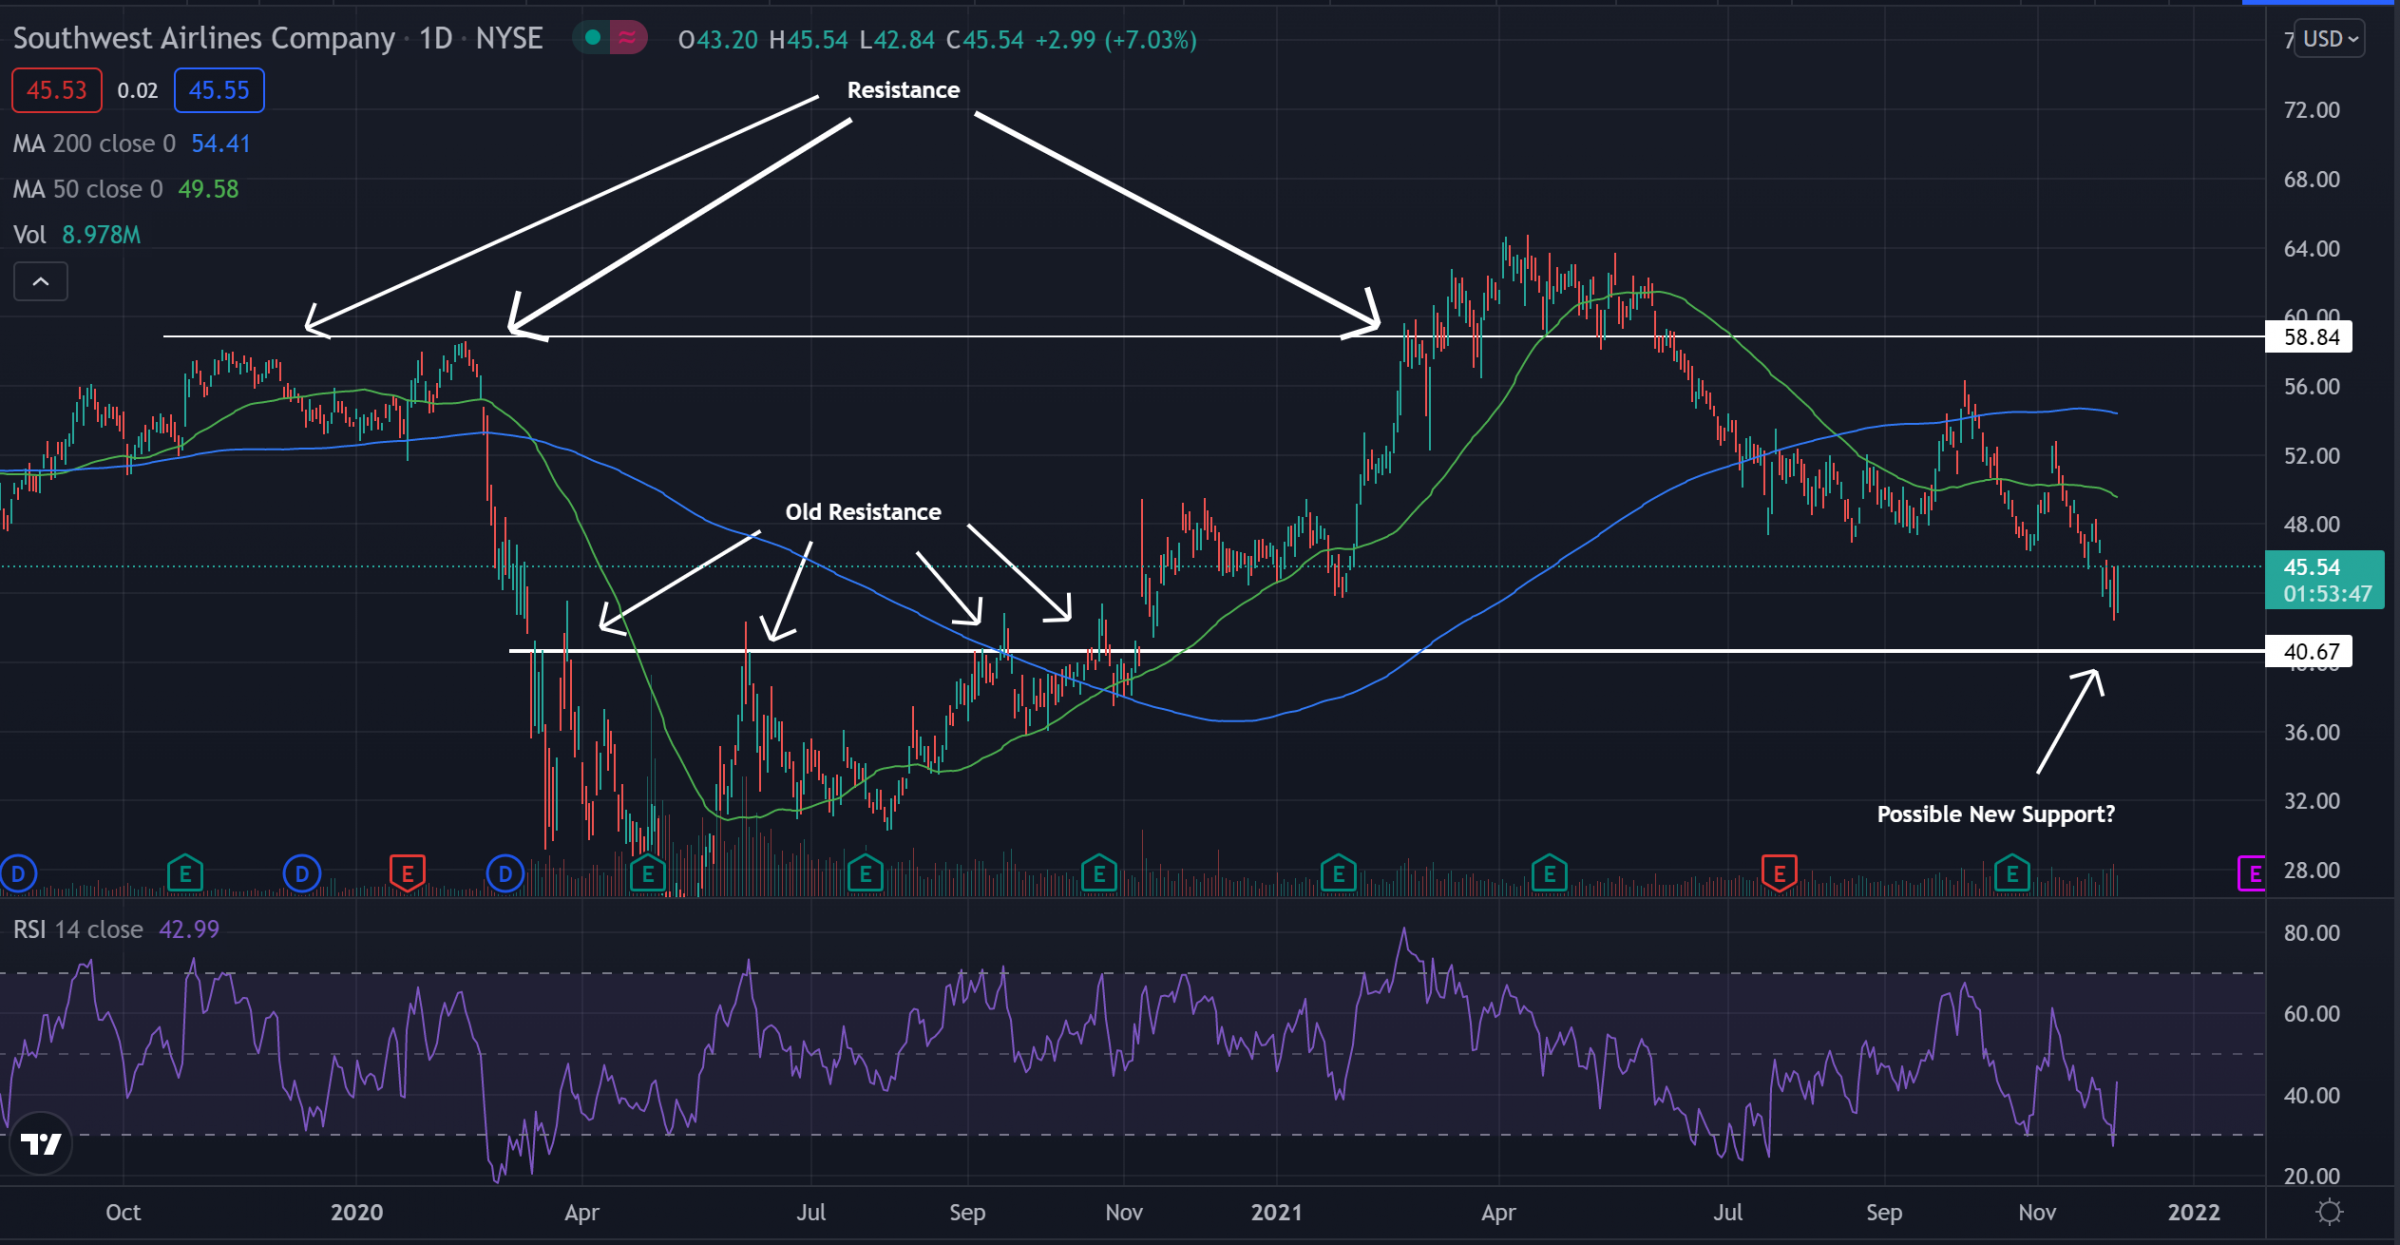
Southwest Daily Chart Analysis
- Shares look to be bouncing off support in what technical traders call a sideways channel.
- The $59 level has been an area where the stock has found resistance in the past, while the $40 was previously resistance and could turn into an area of support in the future.
- The stock is trading below both the 50-day moving average (green) and the 200-day moving average (blue), indicating sentiment has been bearish. These averages may hold as resistance in the future.
- The Relative Strength Index (RSI) looks to be bouncing back and now sits at 42 on the indicator. This shows there are still more sellers than buyers in the stock, but also shows more buyers have been moving into the market in the past few days.
© 2021 Benzinga.com. Benzinga does not provide investment advice. All rights reserved.
How did you like this article? Let us know so we can better customize your reading experience.

Comments
Leave a comment to automatically be entered into
our contest to win a free Echo Show.

