CVNA: Car Retailer Carvana Entered Next Bullish Cycle
Carvana Co. is an online used car retailer and is known for its multi-store car vending machines. Today, the company is the fastest growing online used car dealer in the United States. Recently, Carvana gained publicity as it was named to the 2021 Fortune 500 list, in fact, one of the youngest companies to be added to the list. Founded 2012 and headquartered in Tempe, Arizona, US, it is a part of Russel 1000 small-cap index. Investors can trade it under the ticker CVNA at NYSE.
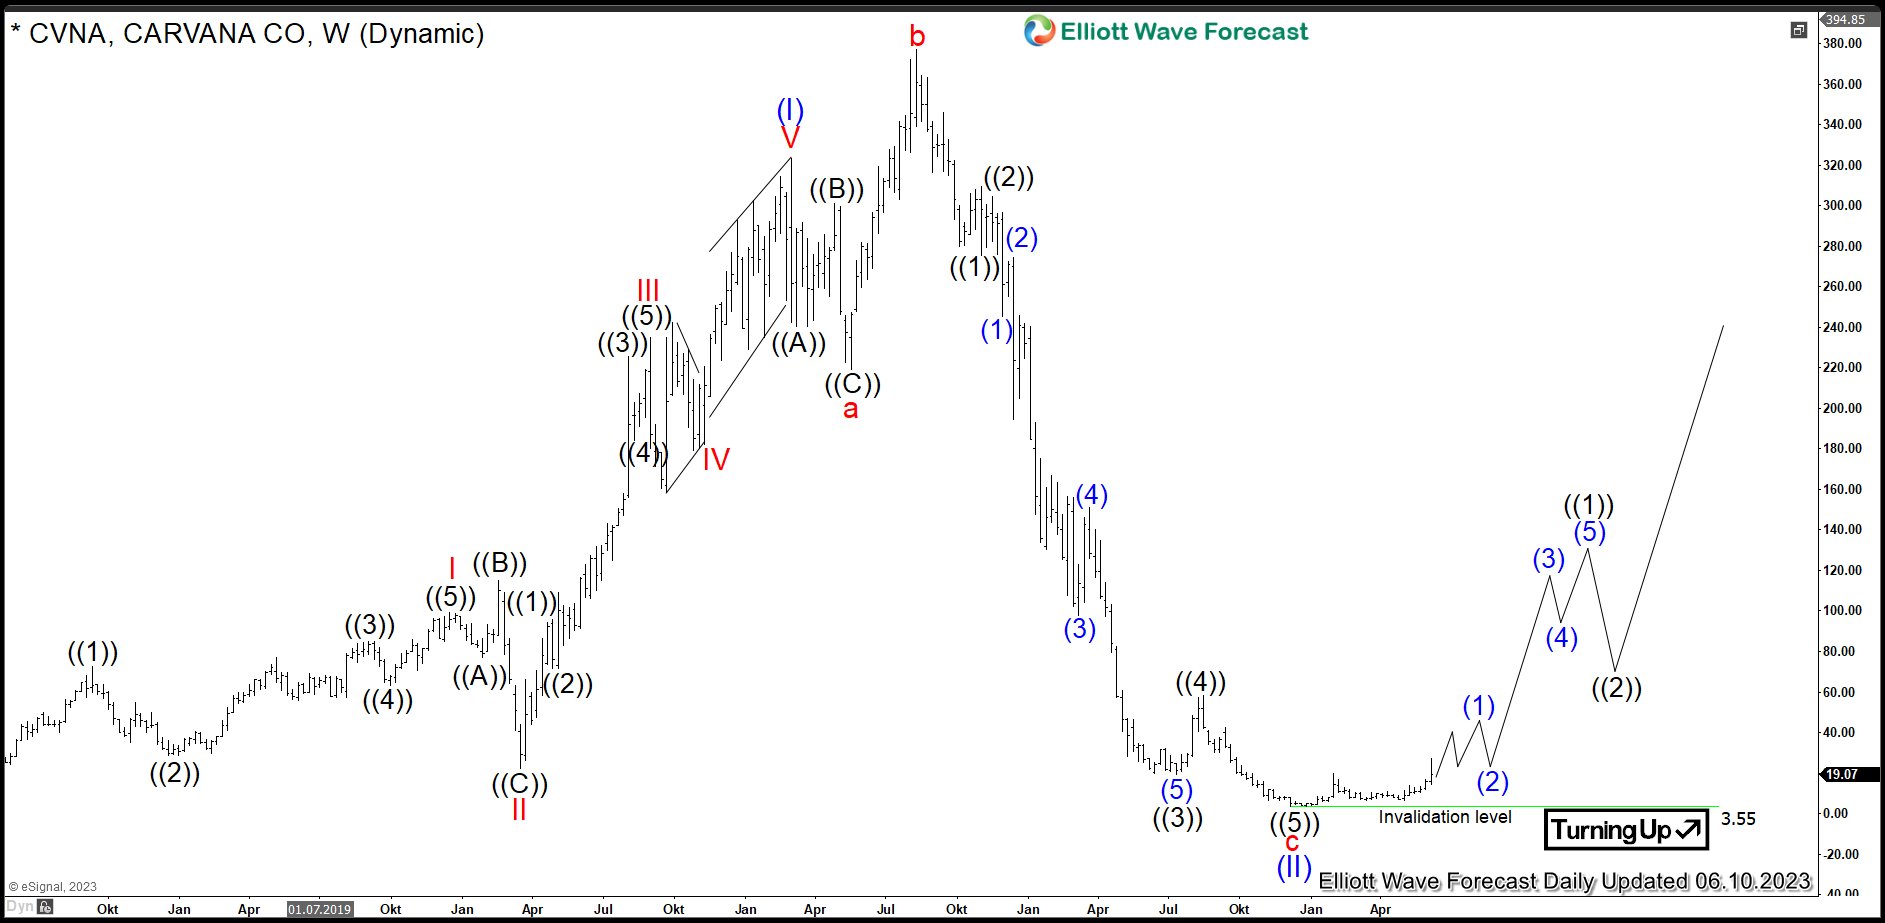
Carvana Weekly Elliott Wave Analysis 06.19.2023
The weekly chart below shows the Carvana shares $CVNA traded at NYSE. From the lows, the stock price has developed an initial cycle higher in blue wave (I) of super cycle degree towards $323.39 highs in March 2021. Hereby, red wave III shows an extension beyond 1.618 multiples of the red wave I. From the March 2021 highs, a correction lower in blue wave (II) has unfolded as an Elliott wave expanded flat pattern being 3-3-5 structure.
Firstly, 3 swings in red wave a of blue wave (II) have printed a low at $222.79 in May 2021. Then, a bounce has set a connector wave b at $376.83 new all-time highs in August 2021. Later on, the price has broken 222.79 lows. Red wave c shows hereby a series of nests and an acceleration lower in blue wave (3) of black wave ((3)) of red wave c. It is the the preferred view that the correction in blue wave (II) has ended in December 2022 at $3.55 lows. As a matter of fact, the descending price and RSI trendlines from the all-time highs have been broken to the upside. While above December 2022 lows, a new bullish cycle in blue wave (III) might have started. The target for the wave (III) is 327-527 area and even beyond.
(Click on image to enlarge)

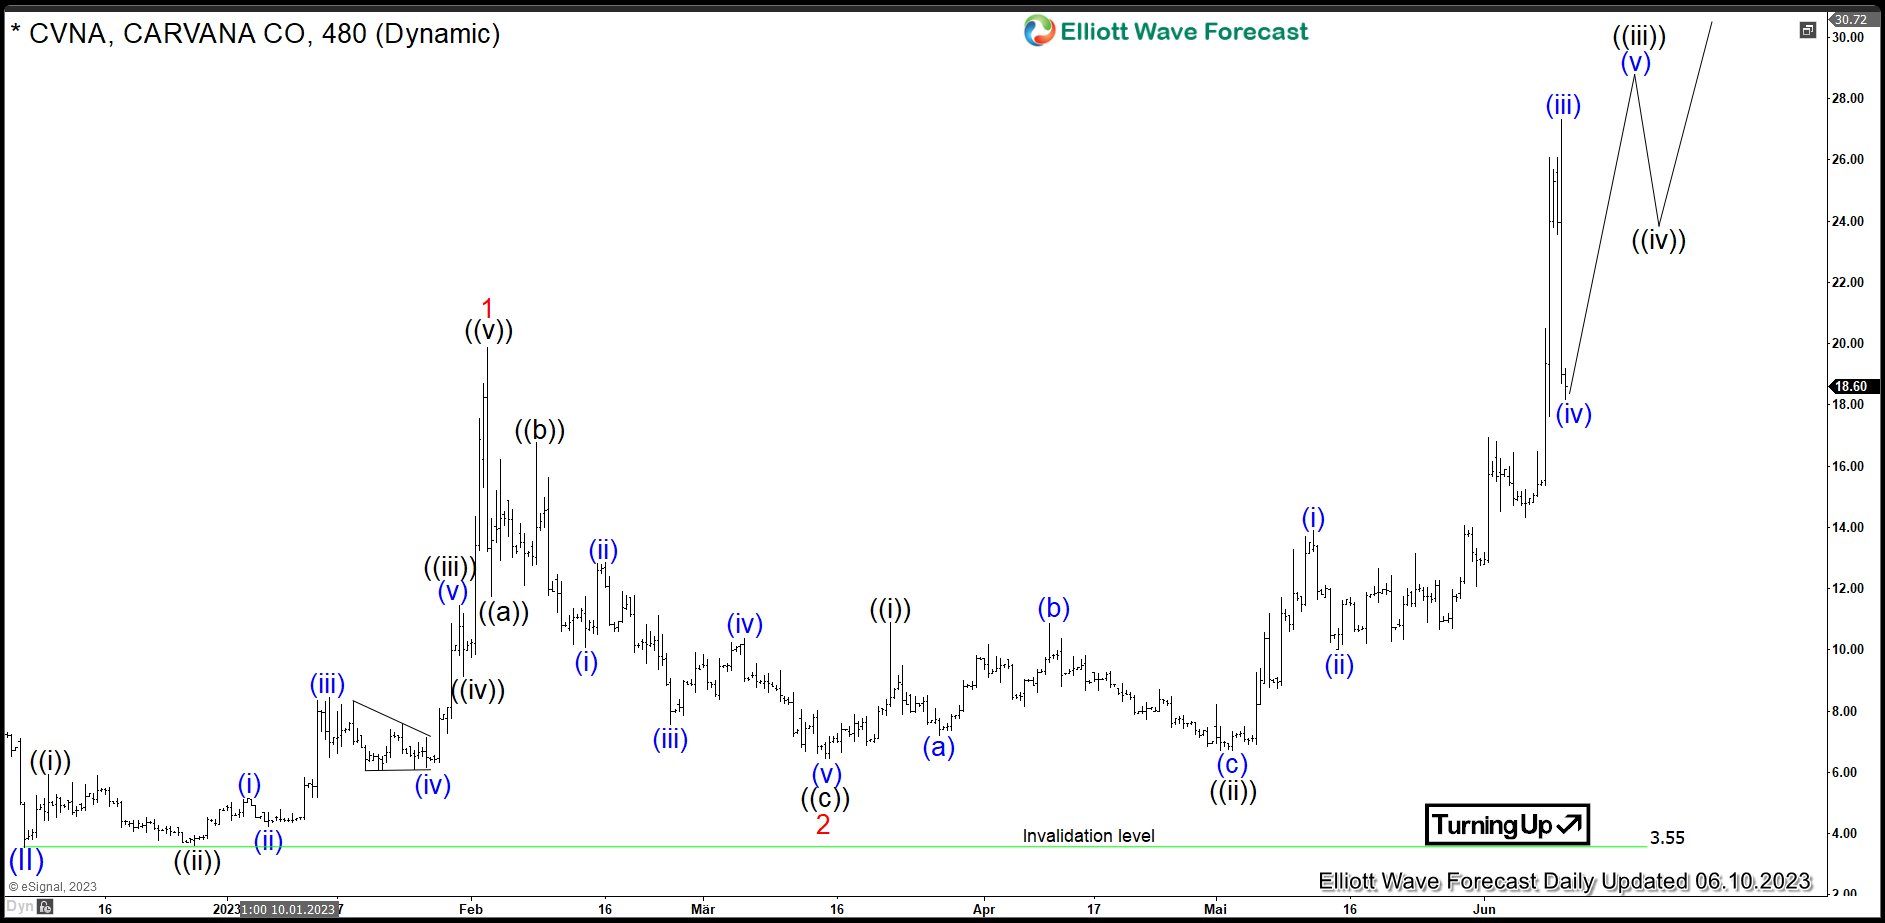
Carvana 8H Elliott Wave Analysis 06.19.2022
The 8 Hour chart below shows in more detail the initial stages of the blue wave (III). From the December 2022 lows at $3.55, blue wave (1) is currently in progress. It can unfold both as an impulse and as a leading diagonal structure. Firstly, 5 waves of red wave 1 have ended in February 2023 at $19.87. From there, a pullback in red wave 2 has ended in March 2023 at $6.45 lows. Then, next cycle in red wave 3 has been confirmed by breaking above $19.87 highs. The target for wave 3 is 22.82-32.96 area and even higher. Once ended, expect waves 4-5 to end the cycle in blue wave (1).
Investors and traders can buy $CVNA in a pullback in 3, 7 swings against $3.55 lows targeting 327-527 area in the long run.
(Click on image to enlarge)

More By This Author:
Tesla Inc. Reacts Higher From The Blue Box Area.QQQ Correcting In Wave 4 And Should Find Buyers
Ethereum Elliott Wave: Forecasting The Path
Disclaimer: Futures, options, and over the counter foreign exchange products may involve substantial risk and may not be suitable for all investors. Leverage can work against you as well as for ...
more


$360 is ineviable short term!