By
Peter Mathers
of
Trading Lounge
Friday, September 16, 2022 5:15 AM EST
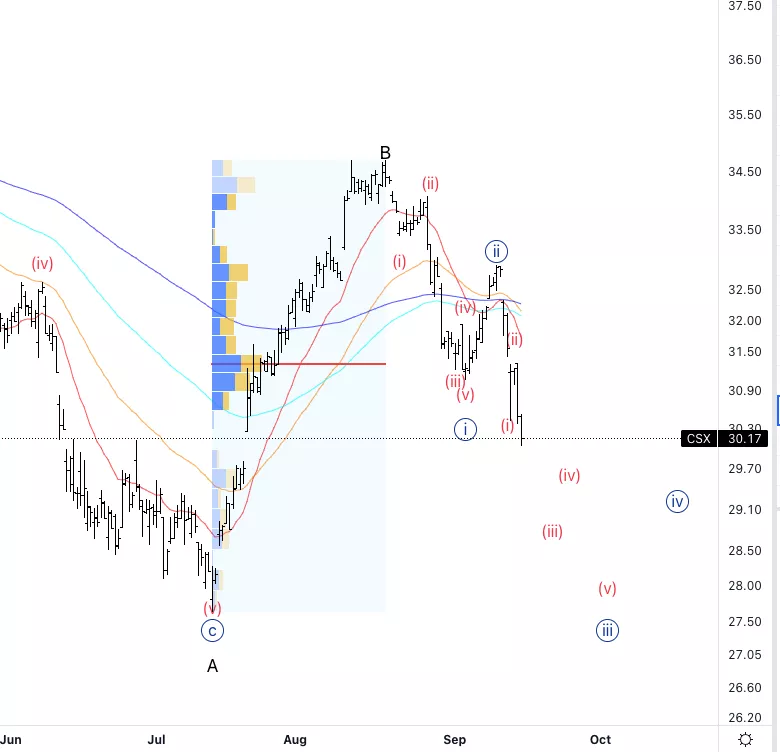
CSX Corp.,(CSX): Daily Chart, September 16 2022,
CSX Stock Market Analysis: Looking for an overall continuation lower, with a potential top in place for wave B.
CSX Elliott Wave count: {iii} of C.
CSX Trading Strategy: Start building shorts with a stop below wave B.
CSX Technical Indicators: We are below all averages which support the bearish scenario.
(Click on image to enlarge)

CSX Corp., HON: 4-hour Chart, September 16 2022
CSX Corp., Elliott Wave Technical Analysis
CSX Stock Market Analysis: Looking for further downside to unfold fairly quickly. If we are in wave (iii) of {iii} then we should see a quick move down.
CSX Elliott Wave count: (iii) of {iii}.
CSX Technical Indicators: Below all averages as well as we already went past the volume point of control.
CSX Trading Strategy: Slowly building shorts, an aggressive stop would be below wave {ii}.
(Click on image to enlarge)
More By This Author:
Elliott Wave Analysis: U.S. Indices - Friday, Sept. 16
Elliott Wave Technical Analysis - Binance Coin
Elliott Wave Analysis: European Indices
Disclosure: As with any trading or investment opportunity there is a risk of making losses especially in day trading or investments that Trading Lounge expresses opinions on. Note: Historical ...
more
Disclosure: As with any trading or investment opportunity there is a risk of making losses especially in day trading or investments that Trading Lounge expresses opinions on. Note: Historical trading results are no guarantee of future returns. Some investments are inherently more risky than others. At worst, you could lose your entire investment and more TradingLounge™ uses a range of technical analysis tools, such as Elliott Wave, software and basic fundamental analysis as well as economic forecasts aimed at minimising the potential for loss. The advice we provide through our TradingLounge™ websites and our TradingLounge™ Membership has been prepared without taking into account your particular objectives, financial situation or needs. Reliance on such advice, information or data is at your own risk. The decision to trade and the method of trading is for you alone to decide, tradinglounge takes no responsibility whatsoever for your trading profits or losses. This information is of a general nature only, so you should, before acting upon any of the information or advice provided by us, consider the appropriateness of the advice in light of your own objectives, financial situation or needs. Therefore, you should consult your financial advisor or accountant to determine whether trading in Indices Stocks shares Forex CFDs Options Spread Betting derivatives of any kind / products is appropriate for you in light of your financial trading circumstances.
less
How did you like this article? Let us know so we can better customize your reading experience.


