

Image Source: Pixabay
CrowdStrike Holdings, Inc. is an American cybersecurity technology company. It provides cloud workload and endpoint security, threat intelligence, and cyberattack response services. Founded 2011 and headquartered in Austin, Texas, U.S., this company is a part of the Nasdaq 100 index.
CrowdStrike Weekly Analysis - Jan. 10, 2024
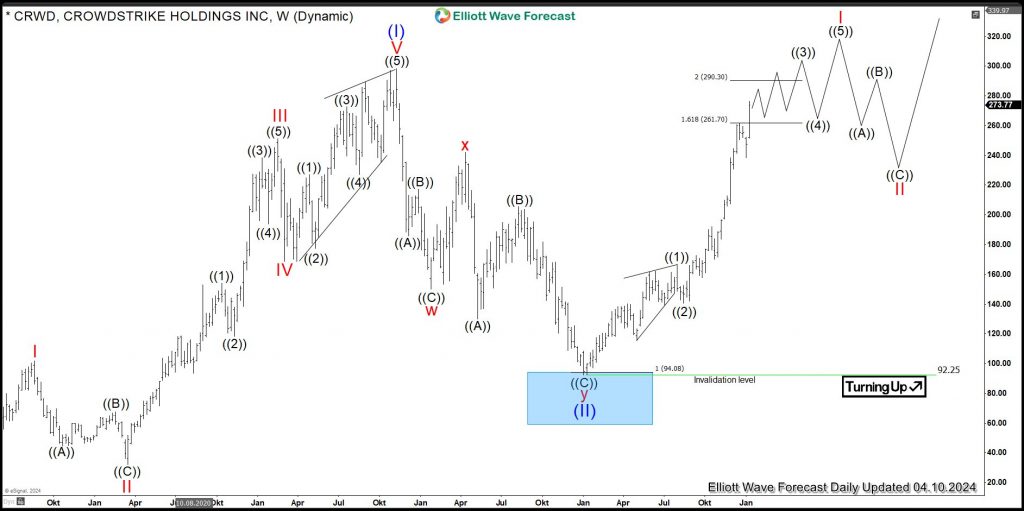
The weekly chart below shows how shares of CrowdStrike traded throughout the recent trading period. From the lows, the stock price has developed an initial cycle higher, as shown by blue wave (I), towards the November 2021 highs of $298.48.
The formation at red wave III shows an extension beyond the initial wave I. After the impulsive structure higher was formed, a correction lower, as shown in blue wave (II), unfolded. This created a wave with a double-three pattern, forming a 3-3-3 structure.
A low at $150.02 was formed in January 2022, as shown by wave 'w' in red within blue wave (II). Then, a bounce was seen from the $242 range in April 2022. Later on, the price broke through those $150.02 lows, thus opening up a bearish sequence. Consequently, the target area for red wave 'y' is within the 94.08-2.44 range. The target was reached, and a reaction from that area occurred.
It appears that wave (II), as shown in blue, bottomed in January of 2023. While above $92.25, a new bullish cycle in blue wave (III) might have started. A break of the $298.48 highs would confirm this.
The target for blue wave (III) is the 391-575 area, or perhaps even higher. Currently, we can see that wave 'I' in red is in progress. Within it, wave ((3)), as shown in black, is within an extension relative to wave ((1)). Short-term, the next targets are $290.30 and $336.57. Once reached, one could expect waves ((4)) and ((5)), as shown in black, to accomplish an impulsive structure within wave I.
Investors and traders should wait for red wave I to end. Then, they can look to buy shares within a pullback as red wave II swings against the $92.25 lows for an acceleration higher in red wave III of blue wave (III).
(Click on image to enlarge)
More By This Author:
Silver Remains SidewaysNvidia Breaks To New All-Time High, What’s Next?
META Looking To End Impulsive Rally Wave


Comments
Log in or sign up to join the conversation.