

To be sure, it's a very busy time for anyone managing money in the markets. As such, I'm going to provide an executive summary of what I see happening at this time.
Summary
The stock market is officially in "growth scare" mode. Worries about recession and EPS estimate revisions have been surging – leading to a "risk-off" environment.
Market Drivers
Last week, earnings reports from Walmart (WMT), Target (TGT), and Ross Stores (ROST) brought profit margin compression (resulting from inflation, labor costs, and supply chain issues) and struggling consumer narratives to the forefront. This week brings another earnings-based fear, as Snap Inc. (SNAP) warned about the macro environment for online advertising "has deteriorated" faster than expected (vs. only a month ago).
This adds to multiple contraction/valuation and growth themes that have plagued trading. The market appears to be in the process of pricing in lower earnings expectations (consensus estimate levels) and recession potential. Macro concerns are being reinforced by this week's dive in bond yields.
Positives
Positives, however, include the Fed's reluctance for 75 bps rate hikes, the pullback in rates, peak inflation and peak hawkishness themes, overall strong consumer (although the low end is being impacted by inflation) and corporate balance sheets, pickup in buyback activity, and China's policy support.
Also supportive are oversold conditions, extreme negative sentiment (highest put/call ratio since March 2020), upcoming quarterly rebalancing adjustments, and "time for a bounce/calling bottom" narratives.
Negatives
Yet, it is prudent to mention that the bear market narrative continues to evolve on the back of the Fed-led global monetary shift. Last week's focus was on inflation pressures on profit margins, which led to concerns about 2022 consensus earnings estimates.
This week it's about systemic risk potential (Bitcoin?) and macro backdrop deterioration (online advertising and recession). Additional concerns include a lack of "Fed put," the growth/valuation narrative, stagflation fears, China's lockdown headwinds, the pickup in equity outflows, and earnings misses.
Where We Are Now
Here are some interesting statistics from Wall Street analysts that are worth noting.
- Deutsche Bank: This is 6th largest non-recession correction in the post-WWII era. Including recessions, the average decline is -23.9%. The bank projects a low of 3650 (-6.4% from the May 20 close).
- Ned Davis Research: The mean decline for cyclical bear markets within a secular bull scenario is -22.8% (3703, or -5%). The mean for all bears is -30.8 (3319, or -15%).
- Credit Suisse: This is the 6th time since 1978 that the S&P 500 has fallen at least 19% but did not enter bear market territory. The following 12 months = big gains in five/six of the years. October 1998 & December 2018: +37%, October 1990: 29.1%, October 2011: 32%. However, three of those times saw the Fed easing serving as a catalyst for a rebound.
Quick Valuation Checks
- Refinitiv: S&P 500 forward (12-month) PE: 16.4 vs. 22 on Dec. 31, 2021. Below the 5-year average of 18.6 and the 10-year average of 16.9.
- NDR: PE multiples have compressed more in this cycle than the average bear market.
- Truist: Over last 90 days, the S&P 500 has seen the sharpest contraction in forward P/E in the past 15 years. The 90-day contraction is at a level below the COVID-19 Crash and 2008.
Summary
It appears that we are dealing with a severe correction/cyclical bear market being driven by the fear of what could happen based on Fed actions and inflation. For me, the bottom line is we are likely closer to the end than the beginning.
Now, let's review the "state of the market" through the lens of our market models.
The Big-Picture Market Models
We start with six of our favorite long-term market models. These models are designed to help determine the "state" of the overall market.
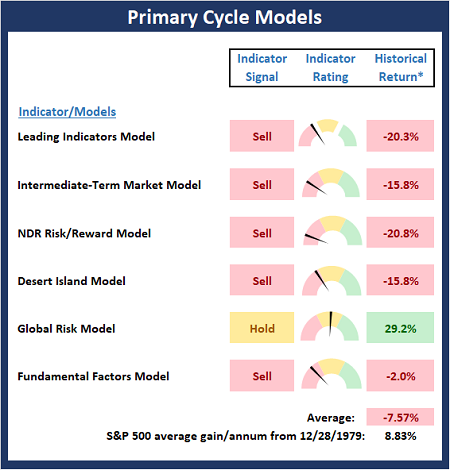
Source: Ned Davis Research (NDR) as of the date of publication. Historical returns are hypothetical average annual performances calculated by NDR.
The Fundamental Backdrop
Next, we review the market's fundamental factors including interest rates, the economy, earnings, inflation, and valuations.
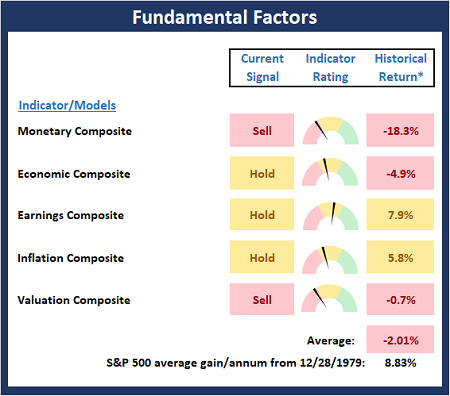
Source: Ned Davis Research (NDR) as of the date of publication. Historical returns are hypothetical average annual performances calculated by NDR.
The State of the Trend
After reviewing the big-picture models and the fundamental backdrop, I like to look at the state of the current trend. This board of indicators is designed to tell us about the overall technical health of the market's trend.
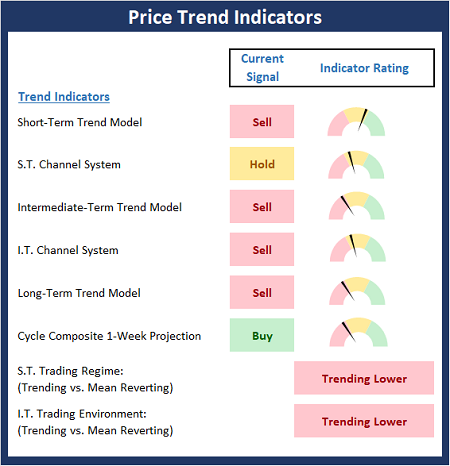
Source: Ned Davis Research (NDR) as of the date of publication. Historical returns are hypothetical average annual performances calculated by NDR.
The State of Internal Momentum
Next, we analyze the momentum indicators/models to determine if there is any "oomph" behind the current move.
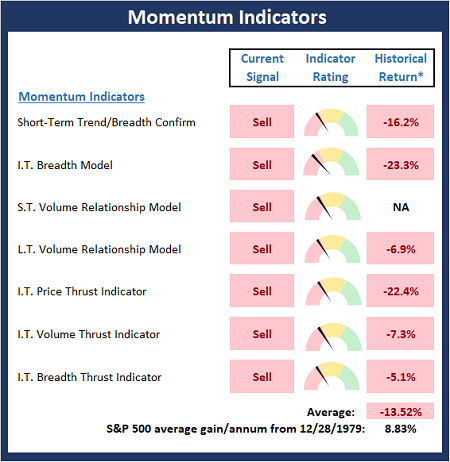
Source: Ned Davis Research (NDR) as of the date of publication. Historical returns are hypothetical average annual performances calculated by NDR.
Early Warning Indicators
Finally, we look at our early warning indicators to gauge the potential for countertrend moves. This batch of indicators is designed to suggest when the table is set for the trend to "go the other way."
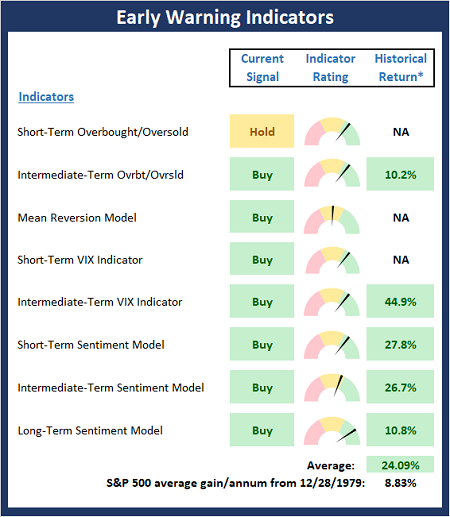
Source: Ned Davis Research (NDR) as of the date of publication. Historical returns are hypothetical average annual performances calculated by NDR.


Comments
Log in or sign up to join the conversation.