
Church & Dwight Co. (CHD) Outperforms The Market In A Weaker Economy
Summary
Church & Dwight’s price pattern is closely related to the business cycle.
Church & Dwight outperform the market when business slows down.
Church & Dwight will continue to outperform the market.
Church & Dwight Co., Inc. develops, manufactures, and markets household, personal care, and specialty products in the United States and internationally. It operates in three segments: Consumer Domestic, Consumer International, and Specialty Products Division.
The company offers cat litters, carpet deodorizers, laundry detergents, and baking soda, as well as other baking soda based products under the Arm & Hammer brand; condoms, lubricants, and vibrators under the Trojan brand; stain removers, cleaning solutions, laundry detergents, and bleach alternatives under the Oxiclean brand; battery-operated and manual toothbrushes under the Spinbrush brand; home pregnancy and ovulation test kits under the First Response brand; depilatories under the Nair brand; oral analgesics under the Orajel brand; laundry detergents under the Xtra brand; gummy dietary supplements under the L'il Critters and Vitafusion brands; dry shampoos under the Batiste brand; water flossers and replacement showerheads under the Waterpik brand; Flawless products; and cold remedy products under the Zicam brand. It also provides specialty products, including animal productivity products, such as Megalac rumen bypass fat, a supplement that enables cows to maintain energy levels during the period of high milk production; Bio-Chlor and Fermenten, which are used to reduce health issues associated with calving, as well as provides needed protein; and Celmanax refined functional carbohydrate, a yeast-based prebiotic.
(Click on image to enlarge)
Source: StockCharts.com, The Peter Dag Portfolio Strategy and Management
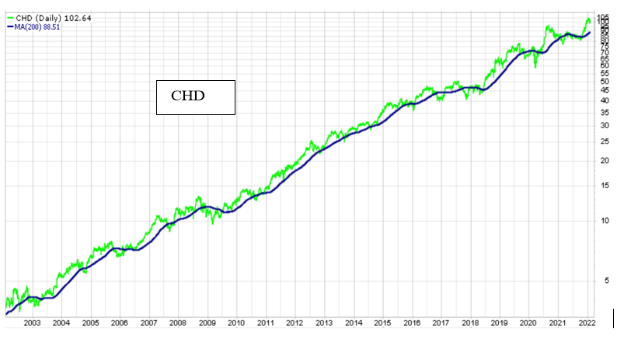
The price chart of Church & Dwight is simply remarkable and reflects the superb performance of management throughout the years.
Although the stock price is at overbought levels from a technical viewpoint (see chart below), its price behavior during a complete business cycle provides opportunities to outperform the market in the current economic environment.
(Click on image to enlarge)

Source: StockCharts.com, The Peter Dag Portfolio Strategy and Management
The stock of Church & Dwight shows a well-defined uptrend in the past 20 years. However, the stock has the chance of outperforming the market only during specific spans of time.
The inventory cycle is helpful to explain why the price of Church & Dwight responds to the business cycle.

Source: Profiting in Bull or Bear Markets - How Business Cycles Impact The Financial Markets
Business managers have a challenging job. They must filter all the news coming from different sources such as pandemics, cartels, supply chain difficulties, foreign or domestic supplier availability, trends in commodities and interest rates, changes in the value of the dollar, and the Fed. Eventually, they must make a crucial decision: how much to produce to replenish the inventories to levels needed to meet demand.
This is a very difficult decision for any company, and it impacts the whole economy. How they respond creates the market volatility we all experience. A case could be made, for instance, the so-called supply chain disruption has been caused by an emotional response as consumers emptied the shelves due to the lockdown. The reaction was to replenish inventories as rapidly as humanly possible.
The business cycle transitions through four phases as management changes its inventory policies. In Phase 1 and Phase 2 business decides to build inventories to meet growing demand. This decision results in increases in the purchase of raw materials, hiring more people, and expand borrowing to finance operations, and improving and boosting capacity.
This is the time the business cycle grows through Phase 1 and Phase 2. This is also the time commodities, copper, iron ore, other metals, crude oil, lumber, agricultural, interest rates, and inflation bottom. Their rise signals the business cycle has transitioned to Phase 2. The increase in these prices is a testimonial economic momentum is feeding on itself.
The problem arises toward the end of Phase 2. The continued rise in commodities, copper, iron ore, other metals, crude oil, lumber, agricultural, and overall inflation eventually reduces consumers’ purchasing power in a meaningful way. The consumers’ response is a slowdown in spending.
The outcome is in Phase 3 managers begin to experience rising inventories compared to sales with a direct impact on their financial performance. This is where we stand now in the business cycle.
The need to reduce inventories involves cuts in the purchase of raw materials, reduction in the workforce, and declines in borrowing. This process continues until inventories are in line with demand. The inventory to sales ratio keeps rising during these times as inventories keep rising faster than sales. During Phase 3 and Phase 4, because of the action of business decisions to cut inventories, commodities, including iron, copper, most metals, and crude oil, decline, wages slow down, and interest rates decline.
When inventories are finally adjusted to the desired level, matching their growth with the growth of demand, the business cycle transitions from Phase 4 to Phase 1. At this point, the inventory to sales ratio starts declining again. It reflects sales rising faster than inventories. Businesses will have to increase production to restock inventories. And the business cycle moves to Phase 1. The markets will respond promptly.
In my article published on 10/26/21 Consumers Will Cause A Recession And A Bear Market (see here) the case was made inflation was going to erode consumers’ income. Such an event has been confirmed by the survey of the University of Michigan showing consumer sentiment and outlook declined to levels rarely seen in the last sixty years. Such elevated pessimism has always been associated with poor economic conditions and possibly a recession.
How do investors react to these developments? When the business cycle transitions into Phase 3 and Phase 4, investors seek companies with predictable financial performance also accompanied by steady demand for their products as made by Church & Dwight. This is the time when its price outperforms the market.
However, when business is in the process of building up inventories (Phase 1 and Phase 2) and the economy comes out of a painful period of slow growth or contraction, investors seek investment likely to produce strong earnings growth. This is the time the stock Church & Dwight underperforms.
(Click on image to enlarge)

Sources: StockCharts.com, The Peter Dag Portfolio Strategy and Management
When does the price of Church & Dwight outperform the market? The above chart gives us the answer.
The above chart shows two panels. The graphs in the above panel represent the ratio between CHD and SPY. The second graph is its 200-day moving average. The graphs rise when CHD outperforms SPY. The graphs decline when CHD underperforms SPY. Investors are going to outperform the market if they invest in CHD when the graphs rise. The graph also indicates CHD has outperformed the market at least since 2007.
The bottom panel shows the business cycle indicator, a proprietary gauge updated regularly in The Peter Dag Portfolio Strategy and Management. This indicator is computed in real-time from market data. Its turning points coincide also with the cyclical turning points of the growth of employment in manufacturing, credit spreads, and growth in margin debt.
The relation of CHD to the business cycle is quite telling. CHD underperforms the market when the business cycle rises, reflecting stronger economic growth and rising commodity prices. The ratio CHD /SPY rises, reflecting the outperformance of CHD relative to SPY, when the business cycle declines, reflecting slower economic growth and lower commodity prices.
The recent weakness in the business cycle indicator suggests CHD will continue to outperform SPY (the ratio CHD/SPY will keep rising) after it corrects from recent overbought levels.
Key takeaways
- The business cycle will decline, reflecting slower economic growth. The slowdown is mostly driven by rising inflation, causing the decline in demand due to the contraction in consumers’ disposable personal income after inflation.
- CHD will continue to outperform SPY as long as the business cycle indicator declines.
- The business cycle indicator will rise following a decline in inflation. Lower inflation will happen when growth in M2 falls from the current 13% to about 6%. Real disposable income will also rise accompanied by improving consumer sentiment (University of Michigan survey).
- CHD will start underperforming the market at that time.
Subscribe to The Peter Dag Portfolio Newsletter by clicking here.


