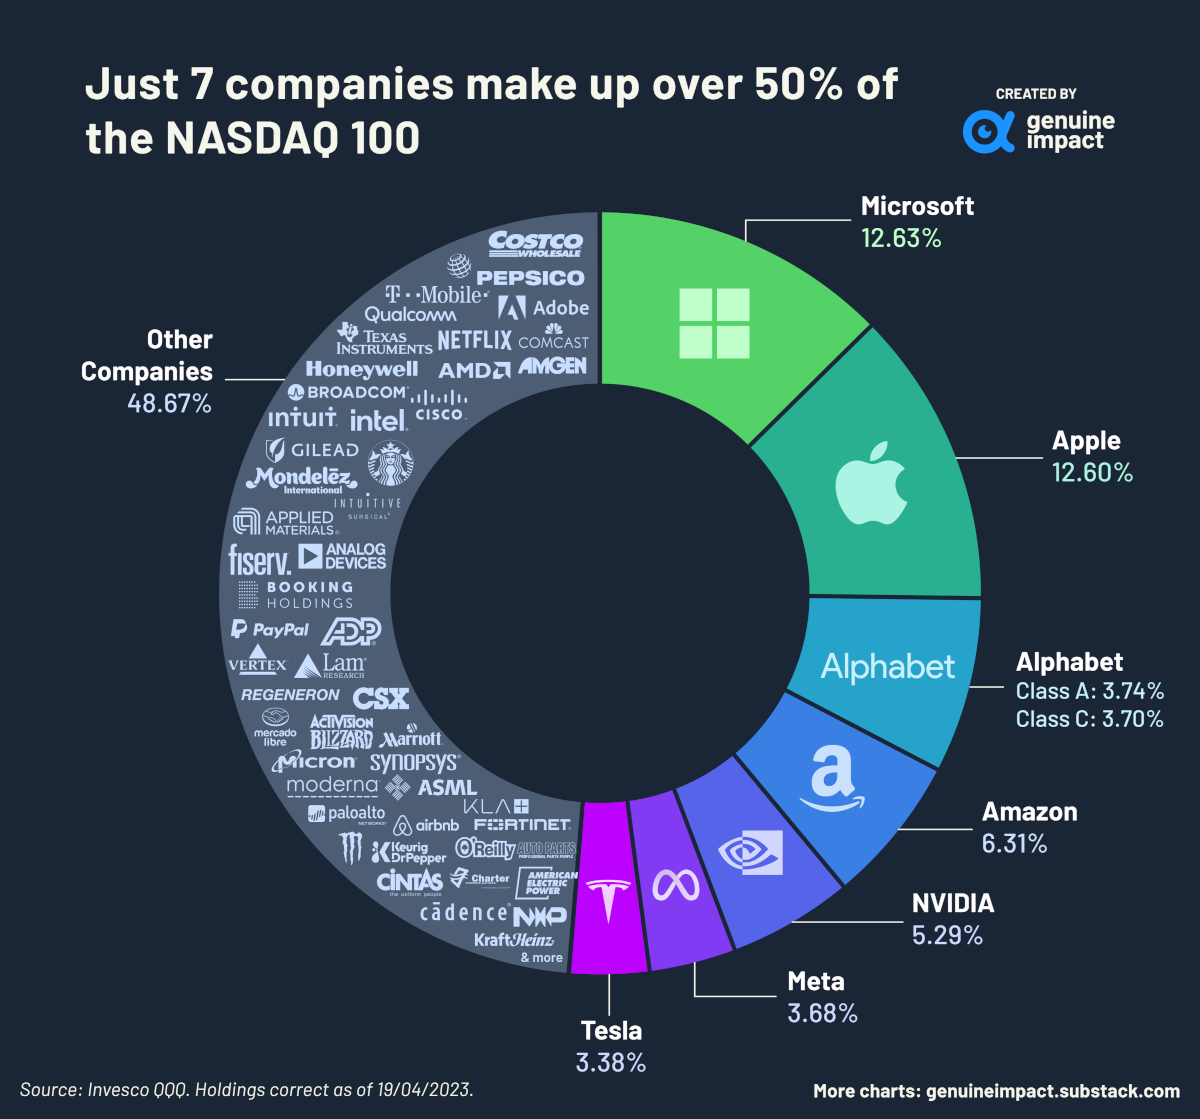
Charted: Companies In The Nasdaq 100, By Weight
(Click on image to enlarge)

Launched in 1985, the Nasdaq 100 index tracks the performance of the largest, and most actively-traded, non-financial companies listed on the Nasdaq stock exchange.
The index is capitalization-weighted, meaning that stock weights in the index are based on each company’s market cap (with some rules to rebalance if companies have an oversized influence). For example, leaders Apple and Microsoft amounted to more than one-fourth of the Nasdaq 100’s total market capitalization alone as of April 2023.
One of the most well-known trackers of the index, Invesco QQQ’s ETF, is the data source for today’s visualization by Truman Du.
Just 7 Companies Dominate the Nasdaq 100
Microsoft and Apple, together with the next five ranked companies, made up over 50% of the total weight of the index in April. These companies are: Alphabet (GOOGL), Amazon (AMZN), NVIDIA (NVDA), Meta Platforms (META), and Tesla (TSLA), with Alphabet’s class A and class C shares occupying two spots.
The dominance of these seven companies within the Nasdaq 100 is a reflection of how central they are to large parts of the wider consumer economy. The economic output and influence of the tech giants speaks for themselves, and Tesla still leads the (rapidly crowding) electric vehicle market.
Perhaps the underdog of the bunch is NVIDIA, which produces graphics processing units (GPUs) that power the visuals in many electronic devices and, more recently, artificial intelligence (AI) systems. The latter in particular has made investors incredibly bullish on the company, as NVIDIA’s stock has risen and the company has recently joined the coveted $1 trillion club.
It’s important to note that this snapshot changes drastically over time. For example, Intel and Cisco were massive components of the Nasdaq 100 in the 2000s but have seen their allocations drop, while others like Yahoo! are no longer publicly traded.
The Pros and Cons of Market Consolidation
Such imbalance in the Nasdaq 100 has both benefits and downsides.
The success of the biggest contingents can pull up the entire index, and the Nasdaq 100 has consistently outperformed broader markets. In fact, $10,000 invested in the Nasdaq 100 in 2013 would be worth $50,000 today, while the same investment in the S&P 500 would now be $30,000.
However, if even one of these large companies underperforms, it can have a major impact on the entire index. This outsized influence can also hide general market woes that may be affecting many other components of the index, and the economy.
With the advent of large language models of AI in 2022, the tech sector is on a precipice. Will AI lead to further profitability—and bigger market caps—or will it render entire companies defunct, leading to a big shakeup in the composition of the Nasdaq 100 index?
More By This Author:
Top 10 Countries By GDP Per Capita, By Region
Comparing Carmaker Revenue Vs. Country GDP
Visualizing BlackRock’s Top Equity Holdings
Disclosure: None.


