Chart Wars: Can Plug Power And Ballard Power Stocks Charge Against The Market?

Ballard Power Systems, Inc BLDP, and Plug Power, Inc PLUG have declined massively over the past year with Ballard trading down about 76% off its Feb. 9 all-time high of $42.28 and Plug Power plummeting about 68% from its all-time high of $75.49, which the stock reached on Jan. 26.
The two fuel cell-focused companies have begun to show some strength recently, however, especially when compared to the general markets that have been volatile and indecisive lately. On Jan. 28, both Ballard and Plug Power printed signs the bottom is in for the stocks, although Plug Power looks slightly stronger over the long-term because it has confirmed a trend change to the upside.
It should be noted that events affecting the general markets, negative or positive reactions to earnings prints, and news headlines about a stock can quickly invalidate patterns and breakouts. As the saying goes, "the trend is your friend until it isn't" and any trader in a position should have a clear stop set in place and manage their risk versus reward.
In The News: Plug Power and Ballard Power will both print fourth-quarter earnings on March 11 and ahead of the event analysts have downgraded the stocks.
On Jan. 26, JPMorgan analyst Bill Peterson maintained an Overweight rating for Plug Power while reducing the price target from $52 to $42. BMO Capital analyst Jonathan Lamers downgraded Ballard Power on Feb. 7 to Market Perform and cut the price target almost in half to $10. Despite the downgrades, Peterson still believes Plug Power will become the sector leader, while Lamers believes Ballard Power’s revenue growth will underperform fuel cell sector leaders through 2022.
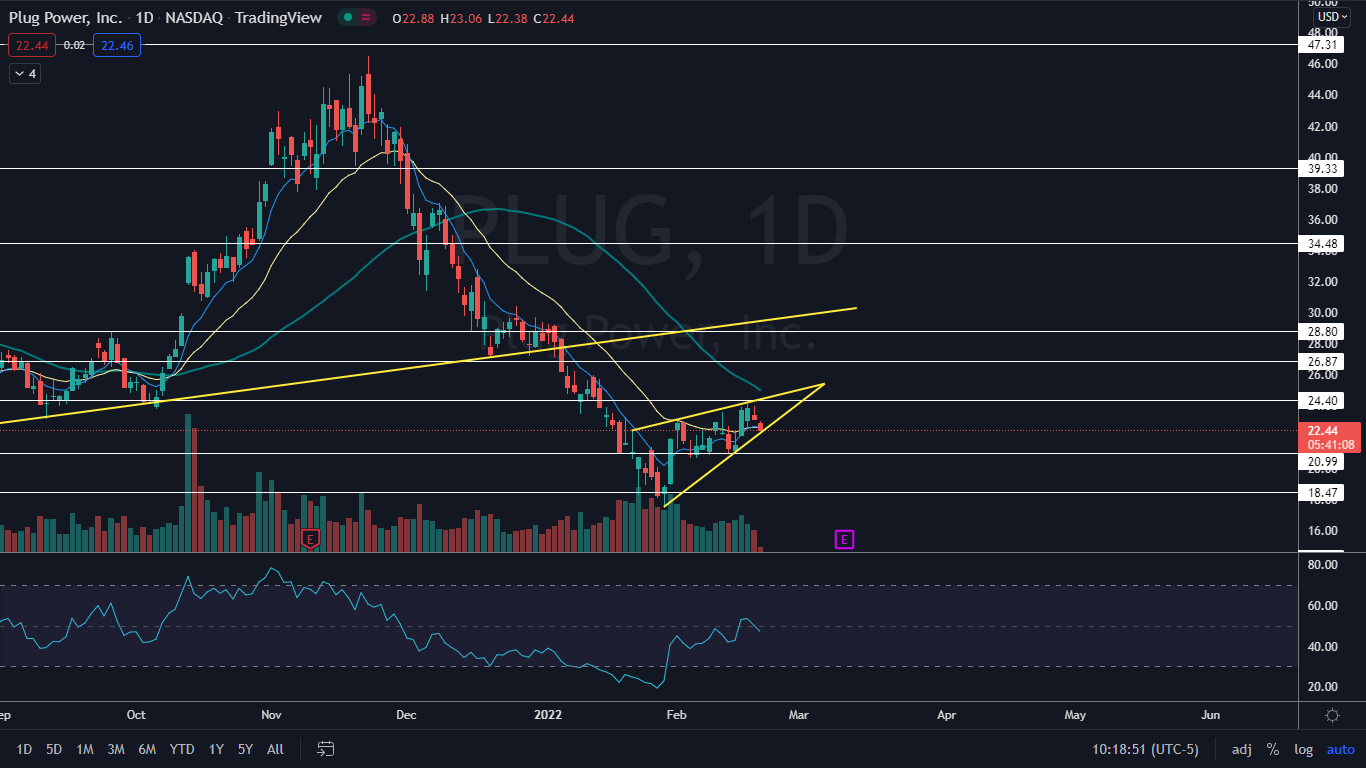
The Plug Power Chart: Plug Power is trading in a confirmed uptrend, with the most recent higher high created on Feb. 16 at the $24.40 level and the most recent higher low possibly printing on Friday at $22.38. Traders can watch for Plug Power to print a reversal candlestick such as a doji to indicate the higher low is in.
- Plug Power may also be trading in a rising wedge pattern on the daily chart. The stock is set to meet to apex of the pattern on March 7 and traders can watch for a break up or down from the wedge on higher-than-average volume to gauge future direction and possible enter a bullish or bearish position.
- The stock is trading in line with eight-day and 21-day exponential moving averages (EMAs), with the eight-day and 21-day EMA trending in line with each other, which indicates indecision. Bulls will want to see Plug Power close the trading day above both moving averages.
- Plug Power has resistance above at $24.40 and $26.87 and support below at $20.99 and $18.47.
(Click on image to enlarge)

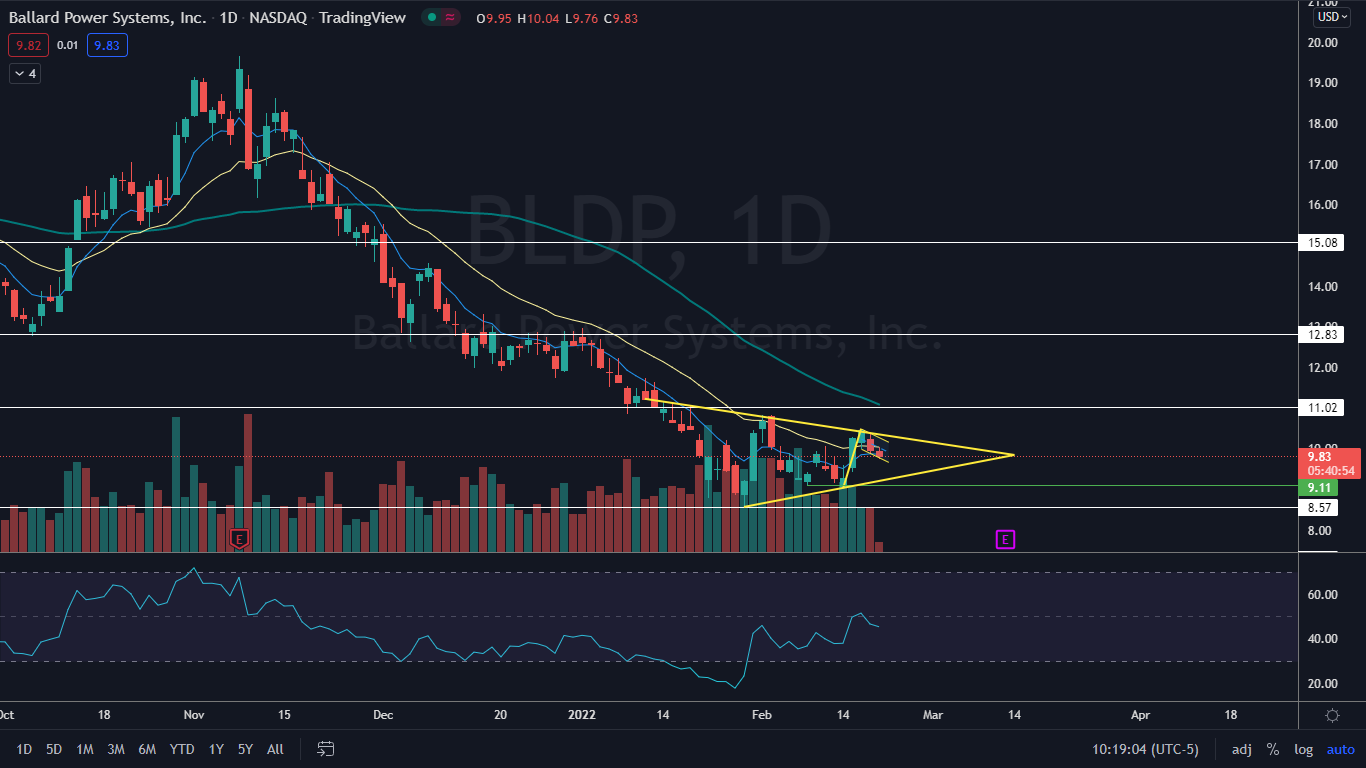
The Ballard Power Chart: On Jan. 28, Ballard reversed into an uptrend but on Feb. 10 was unable to make a higher high above the Feb. 1 high of $10.84 and instead printed a lower high at the $10.08 level. This has caused the stock to make a series of lower highs and higher lows as the weekly trading range tightens.
- On the daily chart, Ballard has settled into a possible symmetrical triangle pattern, with an apex of March 14. Like Plug Power, Ballard is likely to break from the pattern before reaching the apex and traders can watch for that to take place on higher-than-average volume to enter a position.
- Within the symmetrical triangle, Ballard Power may also be settling into a bull flag pattern. If the pattern is recognized, the measured move is about 16%, which indicates Ballard Power could trade up toward the $11 level.
- Ballard has resistance above at $11.02 and $12.83 and support below at $9.50 and $8.57.
(Click on image to enlarge)

© 2022 Benzinga.com. Benzinga does not provide investment advice. All rights reserved.


