
Canopy Growth Stock Wilts: A Technical Analysis

Canopy Growth Corp. CGC shares are trading lower after the stock received a downgrade from Piper Sandler to Underweight.
The stock has been trading in a steady downward trend for the past few months and looking to see if it can make a reversal.
Canopy Growth was down 9.8% at $8.65 at the time of publication.
Canopy Growth Daily Chart Analysis
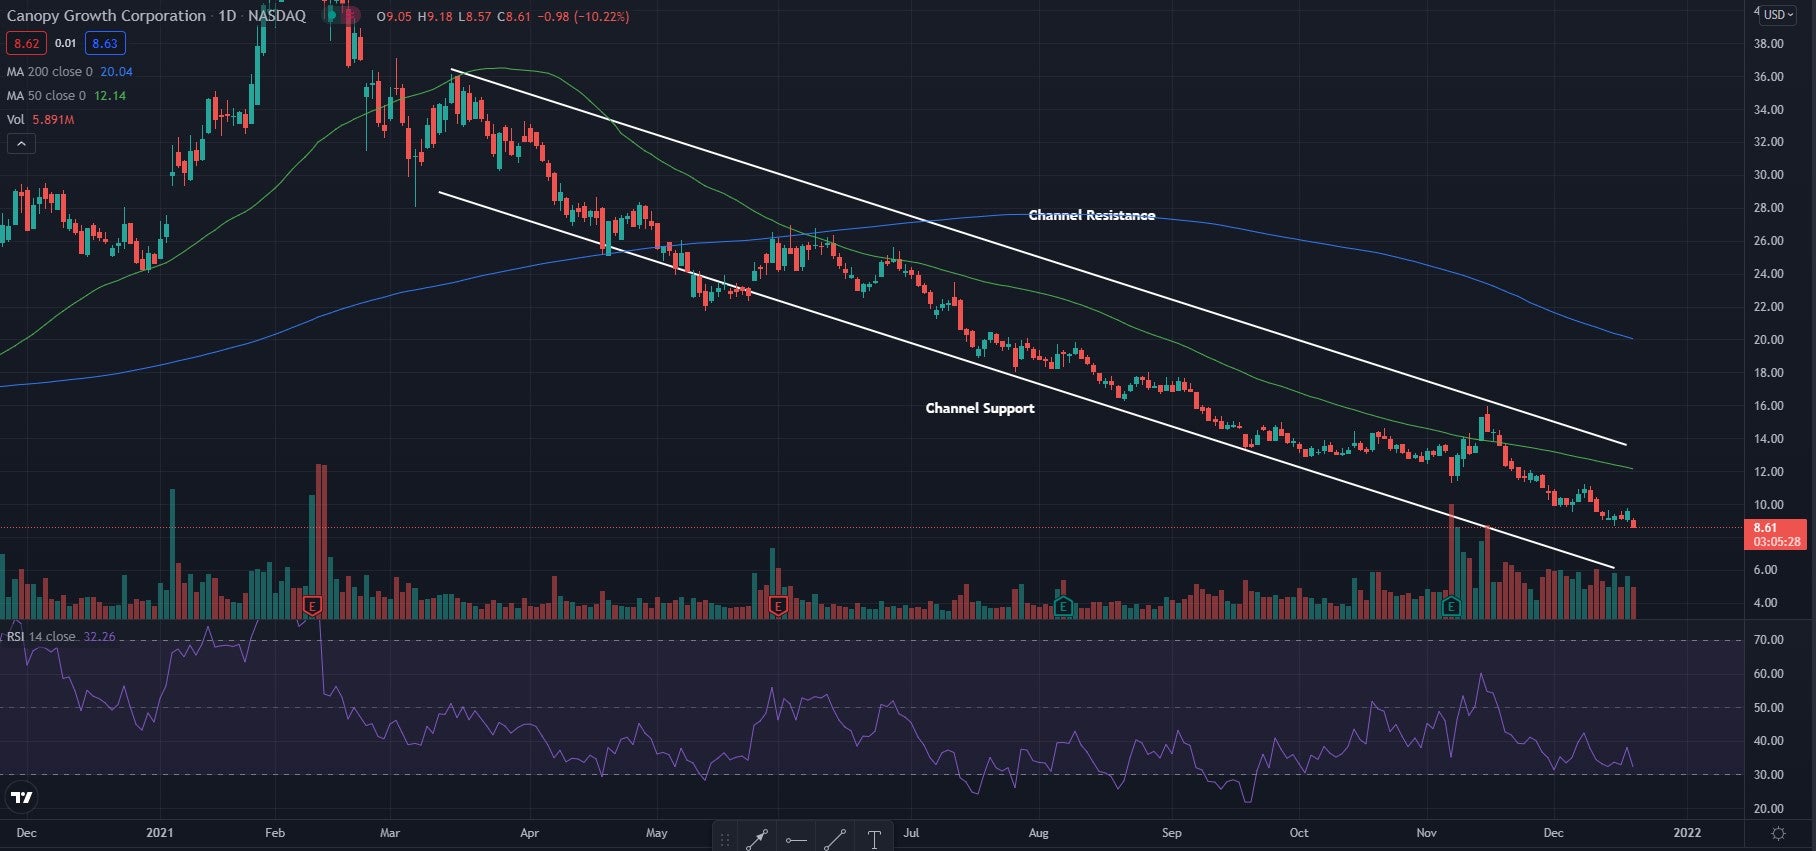
- Shares have been attempting to cross above the $60 level for a time, as it has held as a strong resistance area for the stock. The higher low trendline in the ascending triangle pattern has been broken, as the stock was unable to break out and still holds the $60 level as resistance.
- The stock trades below both the 50-day moving average (green) and the 200-day moving average (blue). This indicates bearish sentiment, and each of these moving averages may hold as an area of resistance in the future.
- The Relative Strength Index (RSI) continues to stay low and sits at 32 on the indicator. This shows the stock is near the oversold area and is seeing many more sellers than buyers. If the RSI continues to stay low, the price will likely continue to fall.
(Click on image to enlarge)
What’s Next For Canopy Growth?
Canopy Growth has been in a strong downtrend for the past few months. As long as the price stays within the channel and trades below the moving averages, bears will be in control of the stock. Bears are looking to see the stock stay within this pattern and see the price continue to fall lower. Bulls are looking to see the stock cross above pattern resistance for the stock to possibly start an uptrend.
© 2021 Benzinga.com. Benzinga does not provide investment advice. All rights reserved.


