Can Bank Stocks Sustain Recent Momentum?
Image Source: Unsplash
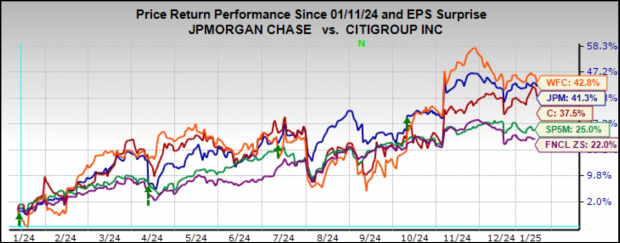
JPMorgan (JPM - Free Report) shares are down a little over -3% since their late-November highs, marginally better than the Zacks Finance sector but lagging the broader market that is essentially flat over the same period. Since the November elections, however, JPMorgan shares are up close to +2%, while the S&P 500 index is modestly in the negative.
Wells Fargo (WFC - Free Report), which joins JPMorgan in kicking off the Q4 earnings season for the Finance sector on Wednesday, January 15th, is barely in positive territory since election day, while Citigroup (C - Free Report), which also reports the same day, has outperformed both of its peers.
Over a longer period, these three banks have handily outperformed the broader market. You can see this in the chart below that shows the one-year performance of JPMorgan, Citigroup, and Wells Fargo relative to the S&P 500 index as well as the Zacks Finance sector.

Image Source: Zacks Investment Research
The outlook for Fed easing that had already dampened following the ‘hawkish cut’ in December is likely to moderate further following the latest blockbuster jobs report. That said, the overall operating environment for these banks has significantly improved lately on the back of a favorable macroeconomic outlook and a relatively more permissive regulatory regime under President Trump.
The development of elevated, longer-dated treasury yields has been an active discussion point in the market, as it seemingly runs counter to the easing monetary policy trajectory. We tend to agree with the view that the ongoing strength in long-term treasury yields is primarily a reflection of favorable economic growth expectations and rising demand for capital due to investment opportunities in secular growth areas like artificial intelligence. Part of it is tied to sticky inflation expectations, but the economic growth angle represents the most significant component.
The bond market’s immediate reaction to the aforementioned blockbuster December jobs report has been to relatively reduce the yield curve’s steepness, but it nevertheless remains far steeper than a few months back. This is positive for net interest income (NII) for these banks, with everything else being constant. There is likely further upside to current 2025 NII estimates, particularly if deposit and loan growth accelerates.
Loan demand has been anemic in recent quarters, with industry data suggesting loan growth of about +1.8% in December, the best rate in over a year. Also notable is that the growth isn’t solely resulting from credit cards, with commercial & industrial loans (C&I) starting to show positive growth.
With respect to credit quality, the problems in the commercial real estate (CRE) market are well-known and already adequately provisioned for at the major banks. Beyond CRE, aggregate bankruptcies in the U.S. are up significantly from the Covid-driven low of early 2022, but the growth rate has been leveling off in recent months.
With current bankruptcy levels roughly 30% below pre-Covid averages, the recent slowing of the bankruptcy growth pace is likely indicative of improved household balance sheets. We also see this trend in early-stage credit card delinquencies, with the flat year-over-year growth rates in recent months indicative of favorable developments concerning net charge-off rates this year.
Concerning investment banking, revenues should be up in the mid-teens percentage range, with JPMorgan and other industry leaders likely enjoying gains in excess of +20%. The equity capital markets business has been particularly strong, with decent gains on the debt capital market side and some early signs of life in the M&A space. On the trading side, volumes were up strong in Q4, while fixed income, currencies, and commodities (FICC) volumes improved during the period after the flattish showing in the first three quarters of the year.
Expectations for JPMorgan, Wells Fargo & Citigroup
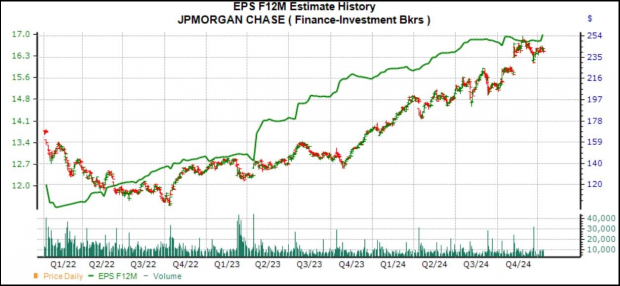
JPMorgan is expected to report $4.02 per share in earnings (up +1.3% year-over-year) on $40.9 billion in revenues (up +6.1% YoY). The stock was up nicely on the last earnings release on October 11th, reflecting positive commentary about the outlook. Estimates have been steadily increasing, with the current $4.02 per share estimate up from $3.82 a month ago and $3.79 three months back.
The chart below shows the JPM stock price performance relative to how the forward 12-month consensus EPS estimate has evolved.

Image Source: Zacks Investment Research
Wells Fargo is expected to report EPS of $1.34 (up +3.9% year-over-year) on $20.5 billion in revenues (up +0.1% YOY). Estimates for Q4 have inched up since the period got underway, with the current $1.34 estimate up from $1.32 a month back and $1.30 three months back. Wells Fargo shares were up following the last quarterly release on October 11th.
For Citigroup, the expectation is of $1.24 per share in earnings (up +47.6% YOY) on $19.6 billion in revenues (up +12.1%). The revisions trend has been modestly positive, with analysts nudging their estimates higher since the quarter began. Citi shares were down following the last quarterly release. But the market’s reaction to any Citi quarterly release is more a function of the market’s assessment of management’s progress in repositioning the business and simplifying the structure than actual quarterly results. We don’t think this report will be any different in that respect.
The Zacks Major Banks industry, of which JPMorgan, Citigroup, and Wells Fargo are a part, is expected to earn +4.4% higher earnings in 2024 Q4 on +3.3% higher revenues. Please note that this industry brought in roughly 50% of the Zacks Finance sector’s total earnings over the trailing four-quarter period.

Image Source: Zacks Investment Research
As you can see above, Q4 earnings for the Zacks Finance sector are expected to be up +11.3% from the same period last year on +4.8% higher revenues.
Despite the big bank stocks’ outperformance over the past year, they are still cheap on most conventional valuation metrics. The chart below shows a 10-year history of the Zacks Major Banks industry for a forward 12-month P/E basis.

Image Source: Zacks Investment Research
At first glance, this valuation picture may look full, if not rich. But we must see the group’s valuation multiple relative to the broader market.
Looking relative to the S&P 500 index, the Zacks Major Banks industry is currently trading at 66% of the S&P 500 forward 12-month P/E multiple. Over the last 10 years, the industry has traded as high as 78% of the index, as low as 52%, and carries a median of 62%, as the chart below shows.

Image Source: Zacks Investment Research
Q4 Earnings Season Scorecard
The Q4 earnings season will take center stage with the bank results this week. However, the reporting cycle has actually gotten underway, with results from 22 S&P 500 index members. These 22 index members, including bellwether operators such as FedEx, Nike, Oracle, and others, have reported results for their fiscal quarters ending in November. We and other data aggregators count these fiscal November-quarter results as part of the December-quarter tally.
This week brings Q4 results from 18 S&P 500 members, which, in addition to the aforementioned big banks, include UnitedHealthcare, Schlumberger, Fastenal, and others.
Total earnings for the 22 index members that have reported results are up +22% from the same period last year on +5.5% higher revenues, with 72.7% beating EPS estimates and 68.2% beating revenue estimates.
The comparison charts below put the growth rates for these 22 index members with what we had seen from this same group of companies in other recent periods.

Image Source: Zacks Investment Research
The comparison charts below put the Q4 EPS and revenue beats percentages for this group companies relative to what we had seen from them in other recent periods.

Image Source: Zacks Investment Research
The Earnings Big Picture
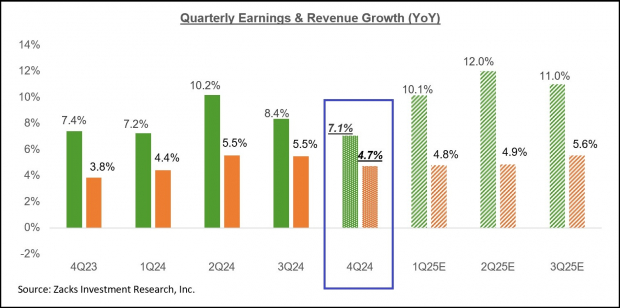
The chart below shows the Q4 earnings and revenue growth expectations in the context of where growth has been in the preceding four quarters and what is expected in the coming three quarters.

Image Source: Zacks Investment Research
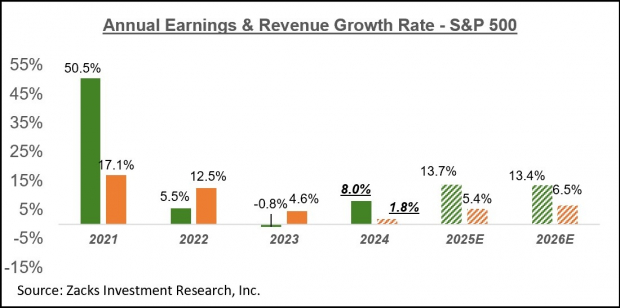
The chart below shows the overall earnings picture on a calendar-year basis, with double-digit earnings growth expected in 2025 and 2026.

Image Source: Zacks Investment Research
More By This Author:
Broad-Based Growth Expected In 2025Q4 Earnings Season Looms: A Preview
Earnings Growth Expected To Broaden Beyond Tech


