C3 AI Inc. Elliott Wave Structure Favors More Downside

Image Source: Pexels
In this technical blog we are going to take a look at the Elliott Wave path in C3 AI Inc. (AI) and explain why the stock should see more downside in a Zig-Zag correction towards a Blue Box area.
C3 AI Inc, founded in 2009, is an American technology company specializing in enterprise artificial intelligence. Based in Redwood City, California. Originally the “C” in the company’s name was a reference to “carbon” and the “3” was a reference to “measure, mitigate and monetize” because the company’s original goal was to help manage corporate carbon footprints.
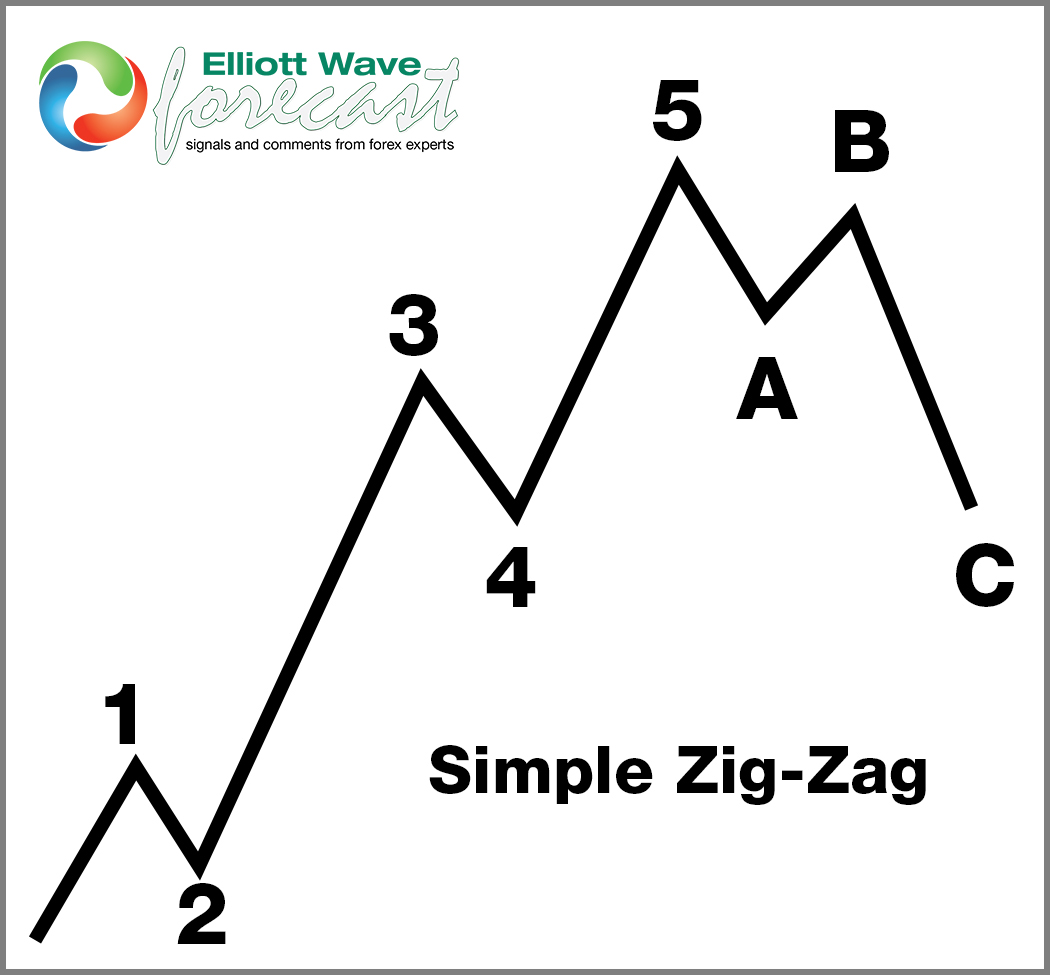
5 Wave Impulse Structure + ABC correction
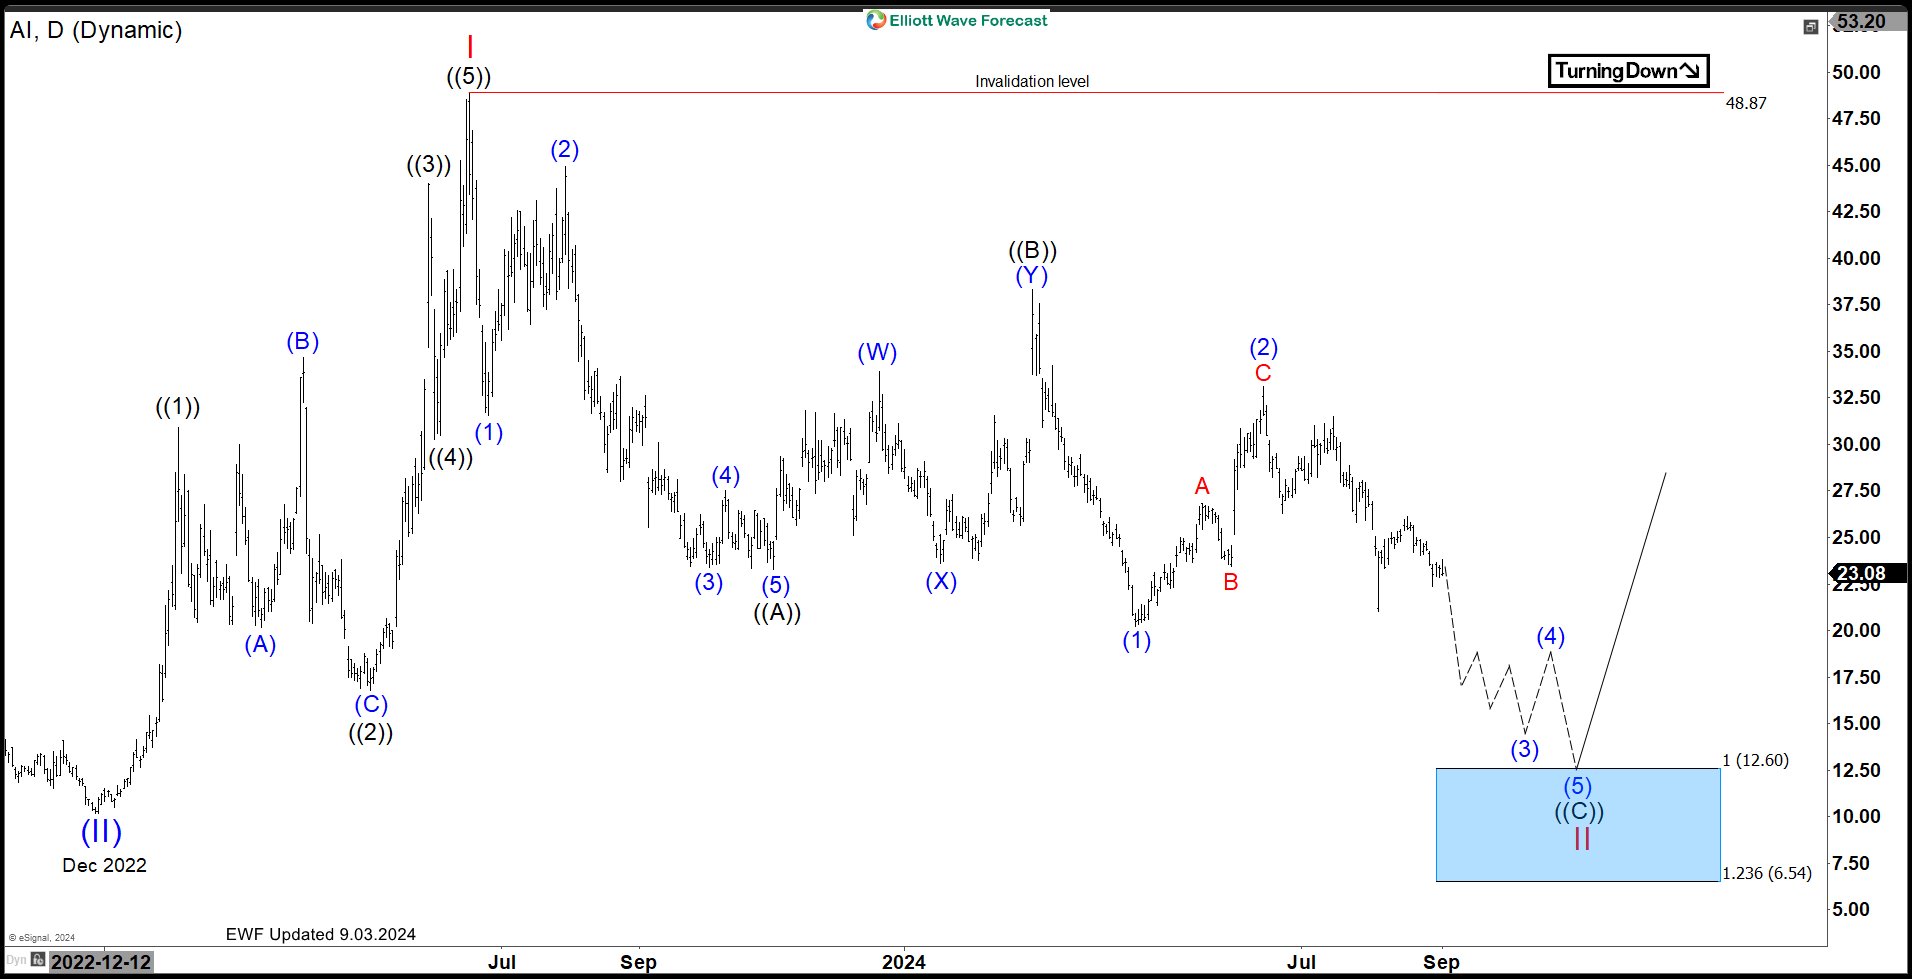
$AI Daily Elliott Wave View – Sep 03, 2024:
The Daily chart above shows the cycle from Dec 2022 low unfold as a 5 waves impulse suggesting the start of a bullish trend. The rally peaked in June 2023 and started a Zig-Zag correction. The first leg lower unfolded in a 5 waves structure followed by a bounce in 3 swings to correct it. The bounce failed at ((B)) and sellers were able to break below wave ((A)) creating a bearish sequence. As a result, sellers are now in control and any bounces are expected to fail in 3 or 7 swings. Buyers can now wait for the blue box area highlighted above to enter again. In conclusion, the stock is favored to remain weak and reach $12.60 – 6.54 where a reaction higher can take place from.
More By This Author:
SPDR Industrial ETF Found Buyers At The Blue Box AreaCrowdStrike Is Not Ready To Resume That Rally; Bull Trap Ahead
Elliott Wave Analysis On Apple 5 Waves Rally Favors Bullish Side
Disclaimer: Futures, options, and over the counter foreign exchange products may involve substantial risk and may not be suitable for all investors. Leverage can work against you as well as for ...
more


