Buying Guangzhou EHang Stock In A Zig-Zag Pullback

Image Source: Pexels
Guangzhou EHang Intelligent Technology Co. Ltd. is a Chinese designer and manufacturer of autonomous aerial vehicles (AAVs) and passenger AAVs. These products have entered service in China for aerial cinematography, photography, emergency response, and survey missions. Founded in 2014, EHang is headquartered in Guangzhou, China.
EHang Weekly Analysis - Dec. 31, 2023
The weekly chart below illustrates how shares of EHang (EH) have recently traded. From the all-time lows, the stock price has moved higher in a cycle, as shown in blue wave (I), towards the February 2021 high of 129.80. After the impulsive structure higher, a correction lower, as shown in blue wave (II), has unfolded as a zig-zag pattern.
The red wave within the blue wave (II) formation initially printed a low at 19.75 in May 2021. Then, a bounce, as shown by wave b, occurred at the 47.38 high in June of the same year.
Later on, the price broke through the 19.75 lows, which opened up the next extension lower. It appears that an important bottom was found in October 2022, as shown by red wave c. While above the 3.32 lows, a new bullish cycle has begun and may be in its initial stages, as demonstrated in blue wave (III).

(Click on image to enlarge)
EHang Daily Analysis - Dec. 31, 2023
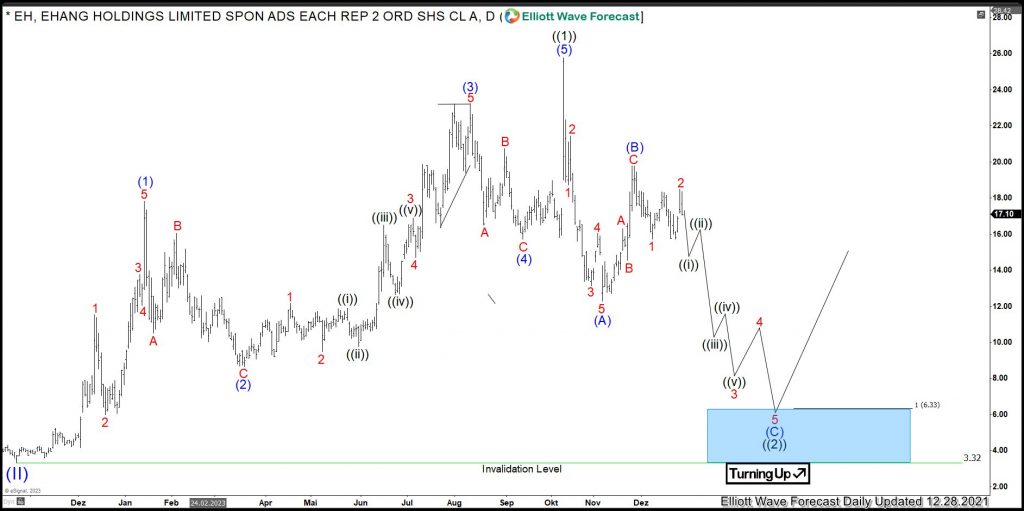
The daily chart below shows a more detailed look at the initial nest in progress, which consists of black waves ((1))-((2)). From the October 2022 lows, the move from black wave ((1)) of red wave I ended in October 2023. It has the pattern of a leading diagonal, being a 5-3-5-3-5 structure.
From the 25.78 highs, a correction, as seen in wave ((2)), should provide an opportunity for an acceleration higher in black wave ((3)). This has seemingly unfolded as a zig-zag pattern.
Firstly, an impulse lower, as shown by the area of blue (A), set a low at 12.30 in November 2023. Secondly, a bounce, as seen in blue wave (B), has printed a connecting high at 19.78. Now, the stock might have started another cycle, as shown in blue wave (C). It should reach the 6.33-3.32 area. Then, one may expect acceleration, as shown in black wave ((3)), towards the 25.78 level and beyond to take place.
Investors and traders may use the 6.33-3.32 bluebox area as a buying opportunity in the stock, perhaps targeting the 25.78 mark and higher in short-term and the 129.80 level and beyond in the long run.

(Click on image to enlarge)
More By This Author:
Boeing Pullback Structure Looks CorrectiveAmerica Airlines Buyers At The Blue Box
Ovintiv Inc. Long Term Bullish Reversal
Disclaimer: Futures, options, and over the counter foreign exchange products may involve substantial risk and may not be suitable for all investors. Leverage can work against you as well as for ...
more


