
Bulls Deserve Benefit Of Doubt
There are times when it can be difficult to make sense of the contrasting messages from market models and the price action playing out on your screens. For me, it is to understand/remember the time frame you are looking at. Obviously, if you are looking at a daily chart of a stock or market index, you are focused on the short-term action. And from a short-term perspective, it is clear that stocks are in some sort of correction/consolidation mode and the key question of the day is if the decline has run its course. However, our Primary Cycle Board looks at the market very differently as these market models are designed to identify the "primary trend" in play. Think bull versus bear. And the time frame utilized by these models tends to be intermediate- to long-term. So, for me, the review the Primary Cycle board each week helps keep the "big picture" in perspective. And for now, at least, the green on the board tells me to give the bulls the benefit of any/all doubt here.
The Big-Picture Market Models
There is one change to note on the Primary Cycle board this week as the Fundamental Factors Model upticked from neutral to positive. While this may sound like a big deal, it was really just one of our monetary models moving up from high-neutral to moderately positive - which was enough to flip the Fundamental Factors model to the low end of positive. As such, I'm going to curb my enthusiasm for the change for now. The key takeaway is that despite the correction/consolidation playing out in the major indices, our favorite market models tell us to remain seated on the bull train and to use the scary pullbacks as opportunities to put capital to work.
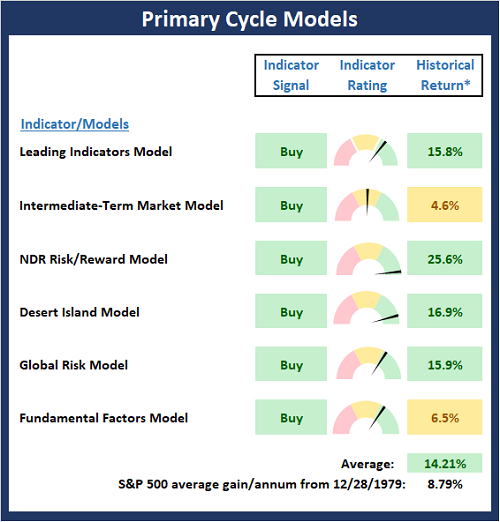
* Source: Ned Davis Research (NDR) as of the date of publication. Historical returns are hypothetical average annual performances calculated by NDR. Past performances do not guarantee future results or profitability - NOT INDIVIDUAL INVESTMENT ADVICE.
Checking In On The "Primary" Cycles
While I don't often make portfolio adjustments based on the long-term trends in the stock market (aka the "primary cycles"), I have found over the years that checking in on state of the cycles and the weekly/monthly charts helps to keep the big-picture in perspective.
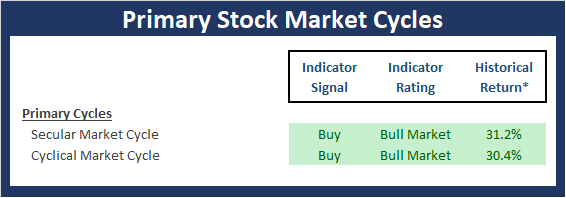
* Source: Ned Davis Research (NDR) as of the date of publication. Historical returns are hypothetical average annual performances calculated by NDR. Past performances do not guarantee future results or profitability - NOT INDIVIDUAL INVESTMENT ADVICE.
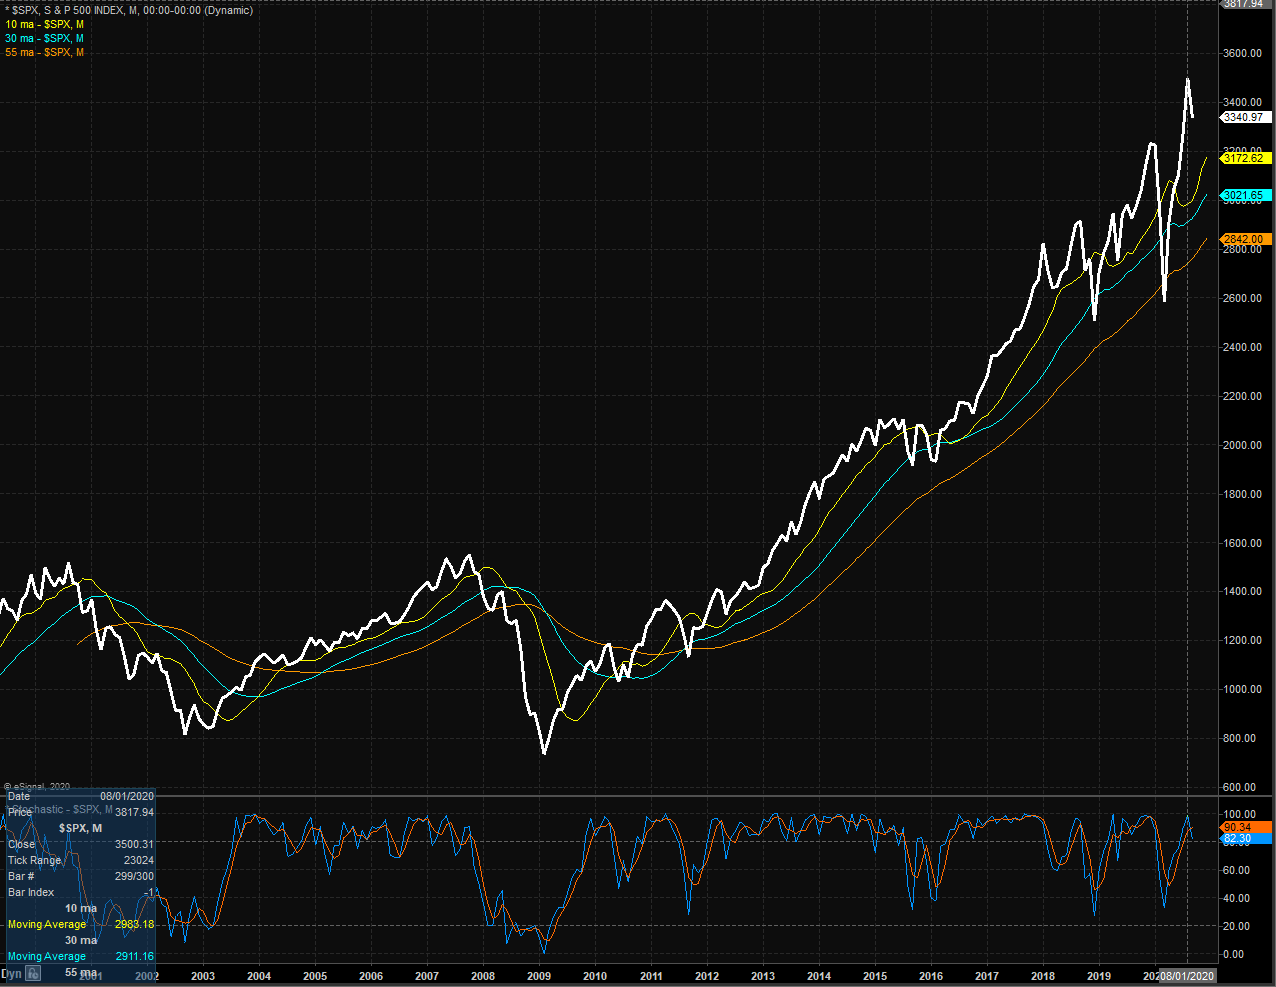
The Secular Market Cycle
Definition: A secular bull market is a period in which stock prices rise at an above-average rate for an extended period (think 5 years or longer) and suffer only relatively short intervening declines. A secular bear market is an extended period of flat or declining stock prices. Secular bull or bear markets typically consist of multiple cyclical bull and bear markets. Below is a monthly chart of the S&P 500 Index illustrating the current cycle, which we estimate began on March 9, 2009.
S&P 500 - Monthly
(Click on image to enlarge)
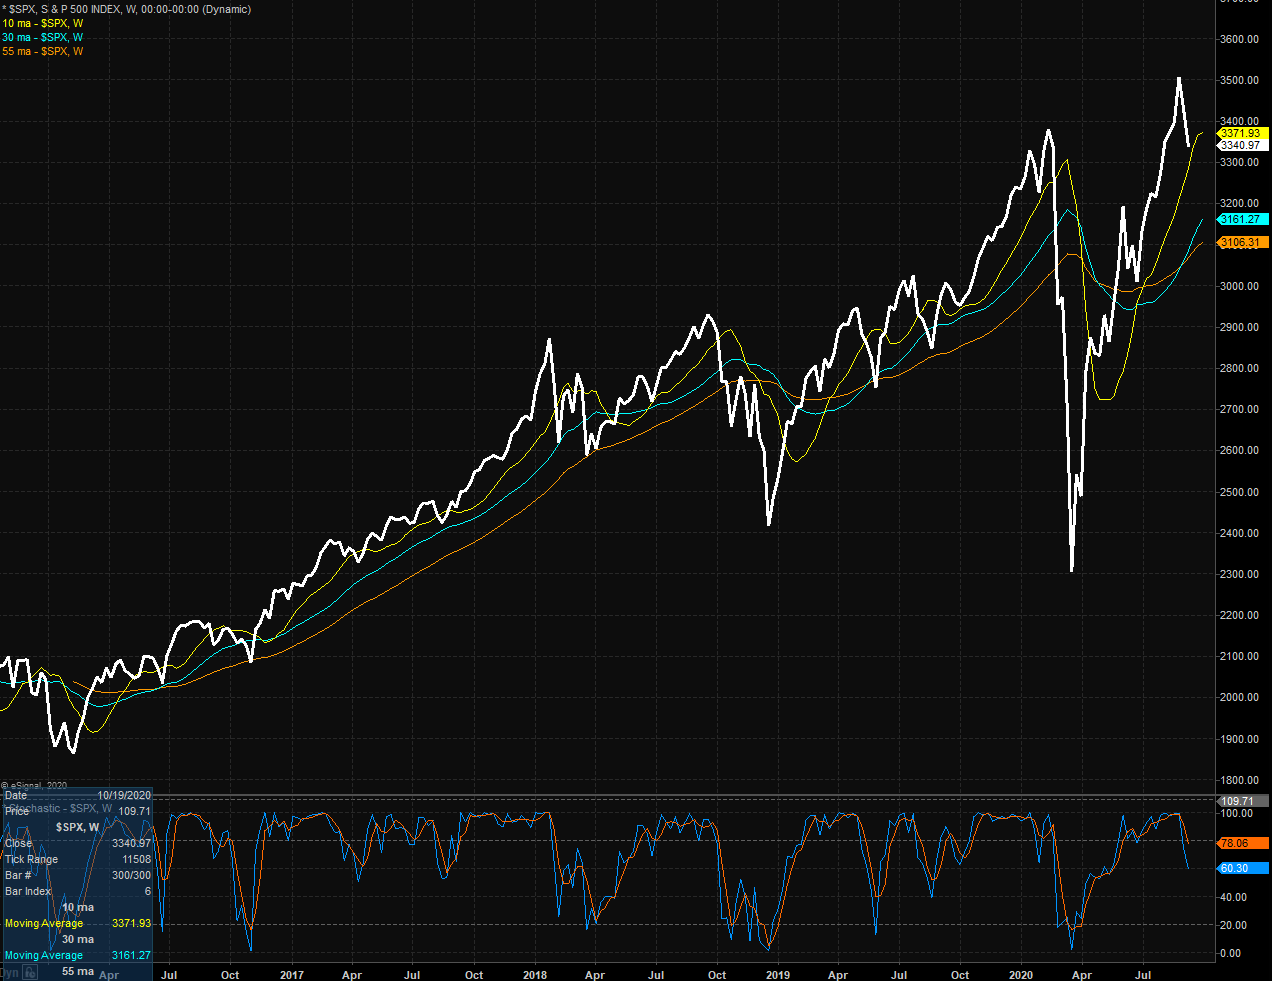
The Cyclical Market Cycle
Definition: A cyclical bull market requires a 30% rise in the DJIA after 50 calendar days or a 13% rise after 155 calendar days. Reversals of 30% in the Value Line Geometric Index since 1965 also qualify. A cyclical bear market requires a 30% drop in the DJIA after 50 calendar days or a 13% decline after 145 calendar days. Reversals of 30% in the Value Line Geometric Index also qualify. Below is a weekly chart of the S&P 500 illustrating the current cycle, which we estimate began on March 24, 2020.
S&P 500 - Weekly
The opinions and forecasts expressed herein are those of Mr. David Moenning and may not actually come to pass. Mr. Moenning's opinions and viewpoints regarding the future of the markets should ...
more

