Breaking Down The Earnings Outlook After Retailers Disappoint

Image: Shutterstock
The stock market has been merciless in response to disappointing Q1 results, with Walmart (WMT) and Target (TGT - Free Report) the most recent victims. Walmart and Target are hardly alone in this respect as a number of other prominent operators also got roughed up at the hands of the market after failing to meet Wall Street expectations.
Staying within the broader retail space, it is instructive to recall that the market’s reaction to Q1 results from Amazon (AMZN - Free Report), eBay (EBAY - Free Report), and Expedia (EXPE - Free Report) was similar to the recent beating Target and Walmart took.
Multiple factors are at play here, ranging from merchandising missteps and failure to accurately read evolving consumer behavior, to coming up short in responding to an admittedly tough operating environment characterized by rising costs. The consumer is still very healthy, supported by low debt loads, adequate savings and rising wages as a result of a tight labor market.
That said, it makes intuitive sense to envision that lower-income consumers will start to feel the squeeze, with rampant inflation eating into, if not altogether offsetting, wage gains. It would make sense for such a consumer to spend less on discretionary items and more on everyday necessities.
There was some of that at play in the Walmart and Target results. But the biggest driver of their disappointing results was weak execution that resulted in compressed margins that forced analysts to lower their outlook for the current and coming quarters.
You can see this in consensus estimates for Walmart and Target, with Walmart’s July quarter EPS estimate down -4.2% in the last few days, while Target slipped -9.1%. As bad as these negative revisions to Walmart and Target estimates are, please keep in mind that the Q2 EPS estimates for Amazon have come down -62.8% in the past month.
Stepping back from these major retail operators and looking at the sector’s earnings expectations as a whole, we see that expectations have notably been adjusted lower.
The Zacks Retail sector, which includes Walmart, Target, Amazon and all the other digital and brick-and-mortar operators, including restaurants, was expected to -0.7% decline in 2022 Q2 earnings at the start of the year. This expected earnings growth rate for the June quarter declined to -1.1% on March 30th. The 2022 Q2 earnings growth rate has dropped to -14.2% at present.
However, if we look at the revisions trend in the aggregate, at the S&P 500 level, we don’t see a lot of movement, as you can see in the chart below that plots the evolution of aggregate Q2 earnings growth estimates for the index since the start of 2022.
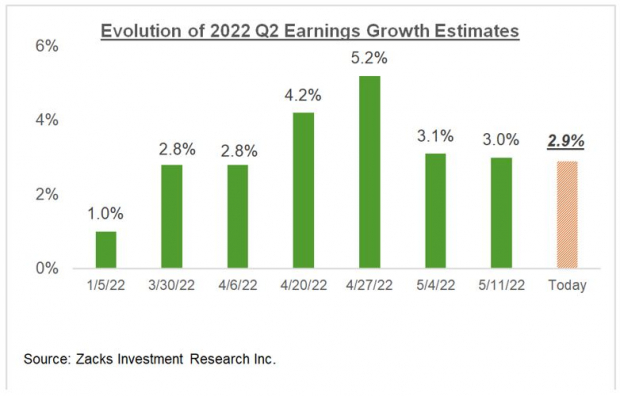
Image Source: Zacks Investment Research
In other words, estimates in the aggregate are essentially unchanged since the beginning of April and are actually up since the start of the year.
But as we saw earlier with the revisions trend for the Zacks Retail sector, there are plenty of cross-currents at the sector level, with positive revisions to the Energy sector offsetting declines in most other sectors.
The Q2 earnings estimates for the Zacks Energy sector have increased +78.5% since the start of January and +41.7% since the beginning of April.
Energy is not the only sector that has enjoyed positive Q2 estimate revisions; there are 5 other sectors whose estimates have gone up by varying magnitudes. Since the start of Q2 on April 1st, earnings estimates have gone up for the Transportation, Basic Materials, Autos, Construction, and Consumer Staples sectors. Of these 5 sectors, the upgrade to the Q2 earnings outlook is particularly significant for the Transportation and Basic Materials sectors.
If we look at the aggregate Q2 revisions, after excluding the Energy sector from the mix, then the picture changes, as you can see below.
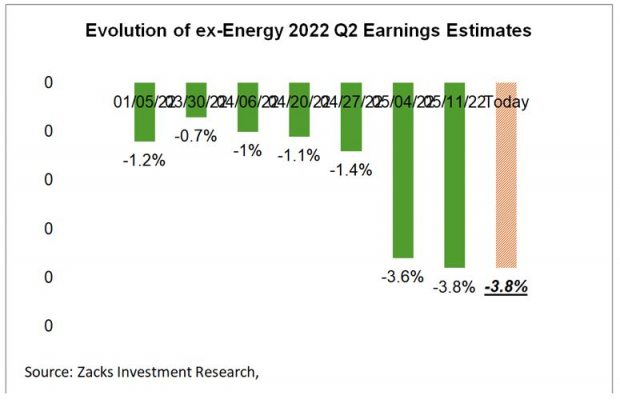
Image Source: Zacks Investment Research
Pretty much the same trend is at play with the revisions on an annual basis, with aggregate estimates stable or even modestly up since the start of the year, but starting to come down on an ex-Energy basis.
I will not share those charts here to keep the length of this piece manageable, but I think it will be useful for you to see what has happened to full-year 2022 earnings estimates for the Energy sector since the start of the year.
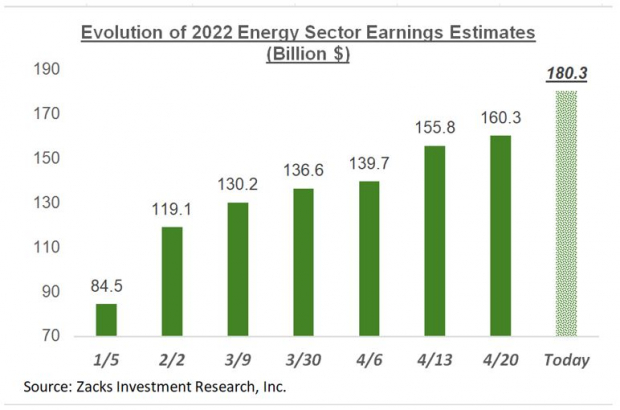
Image Source: Zacks Investment Research
Before I started analyzing the aggregate earnings picture some 12 or so years ago, I used to cover the Energy sector for a living. I have never seen this magnitude of estimate revisions for the Energy sector at any other time, or for any other sector for that matter.
Putting It All Together
The Fed’s monetary policy tightening is expected to slow down the economy. At the expense of over-simplifying a complex development, this is how the Fed confronts inflation in the economy. Expectations of U.S. GDP growth have come down as result. You can see this in consensus GDP growth estimates since the start of year, with the Zacks Economic team currently projecting 2022 GDP growth at +2.3%, down from +3.5% back in January. Estimates for next year have also come down, but not to the same extent.
Since the Fed still has some ways to go in its inflation-fighting quest, is reasonable to expect these GDP growth estimates to come down further.
As you would expect, earnings are a function of the broader economy, though the economy in the earnings discussion is the global economy and not just the domestic one. This is the reason why there is not a perfect correlation between nominal global GDP growth and revenue growth for the S&P 500 index.
Without getting into the debate whether the Fed tightening will push the U.S. economy into a recession or the central bank will be able to engineer the so-called ‘softish’ landing, it is a given that U.S. economic growth is on track to slow down in the coming quarters.
And so should expectations for S&P 500 companies. We have seen some of that already, but it’s reasonable to expect more of that as we move into the second half of the year.
The Current Earnings Backdrop
The chart below shows current expectations (and actuals) on a quarterly basis.
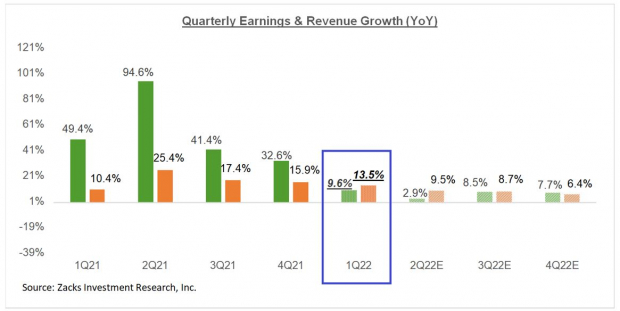
Image Source: Zacks Investment Research
The chart below shows the comparable picture on an annual basis.
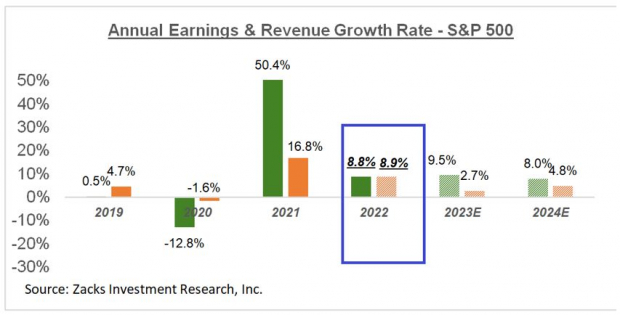
Image Source: Zacks Investment Research
Disclosure: Zacks.com contains statements and statistics that have been obtained from sources believed to be reliable but are not guaranteed as to accuracy or completeness. References to any specific ...
more


