
Breadth Strength Update

Image Source: Unsplash
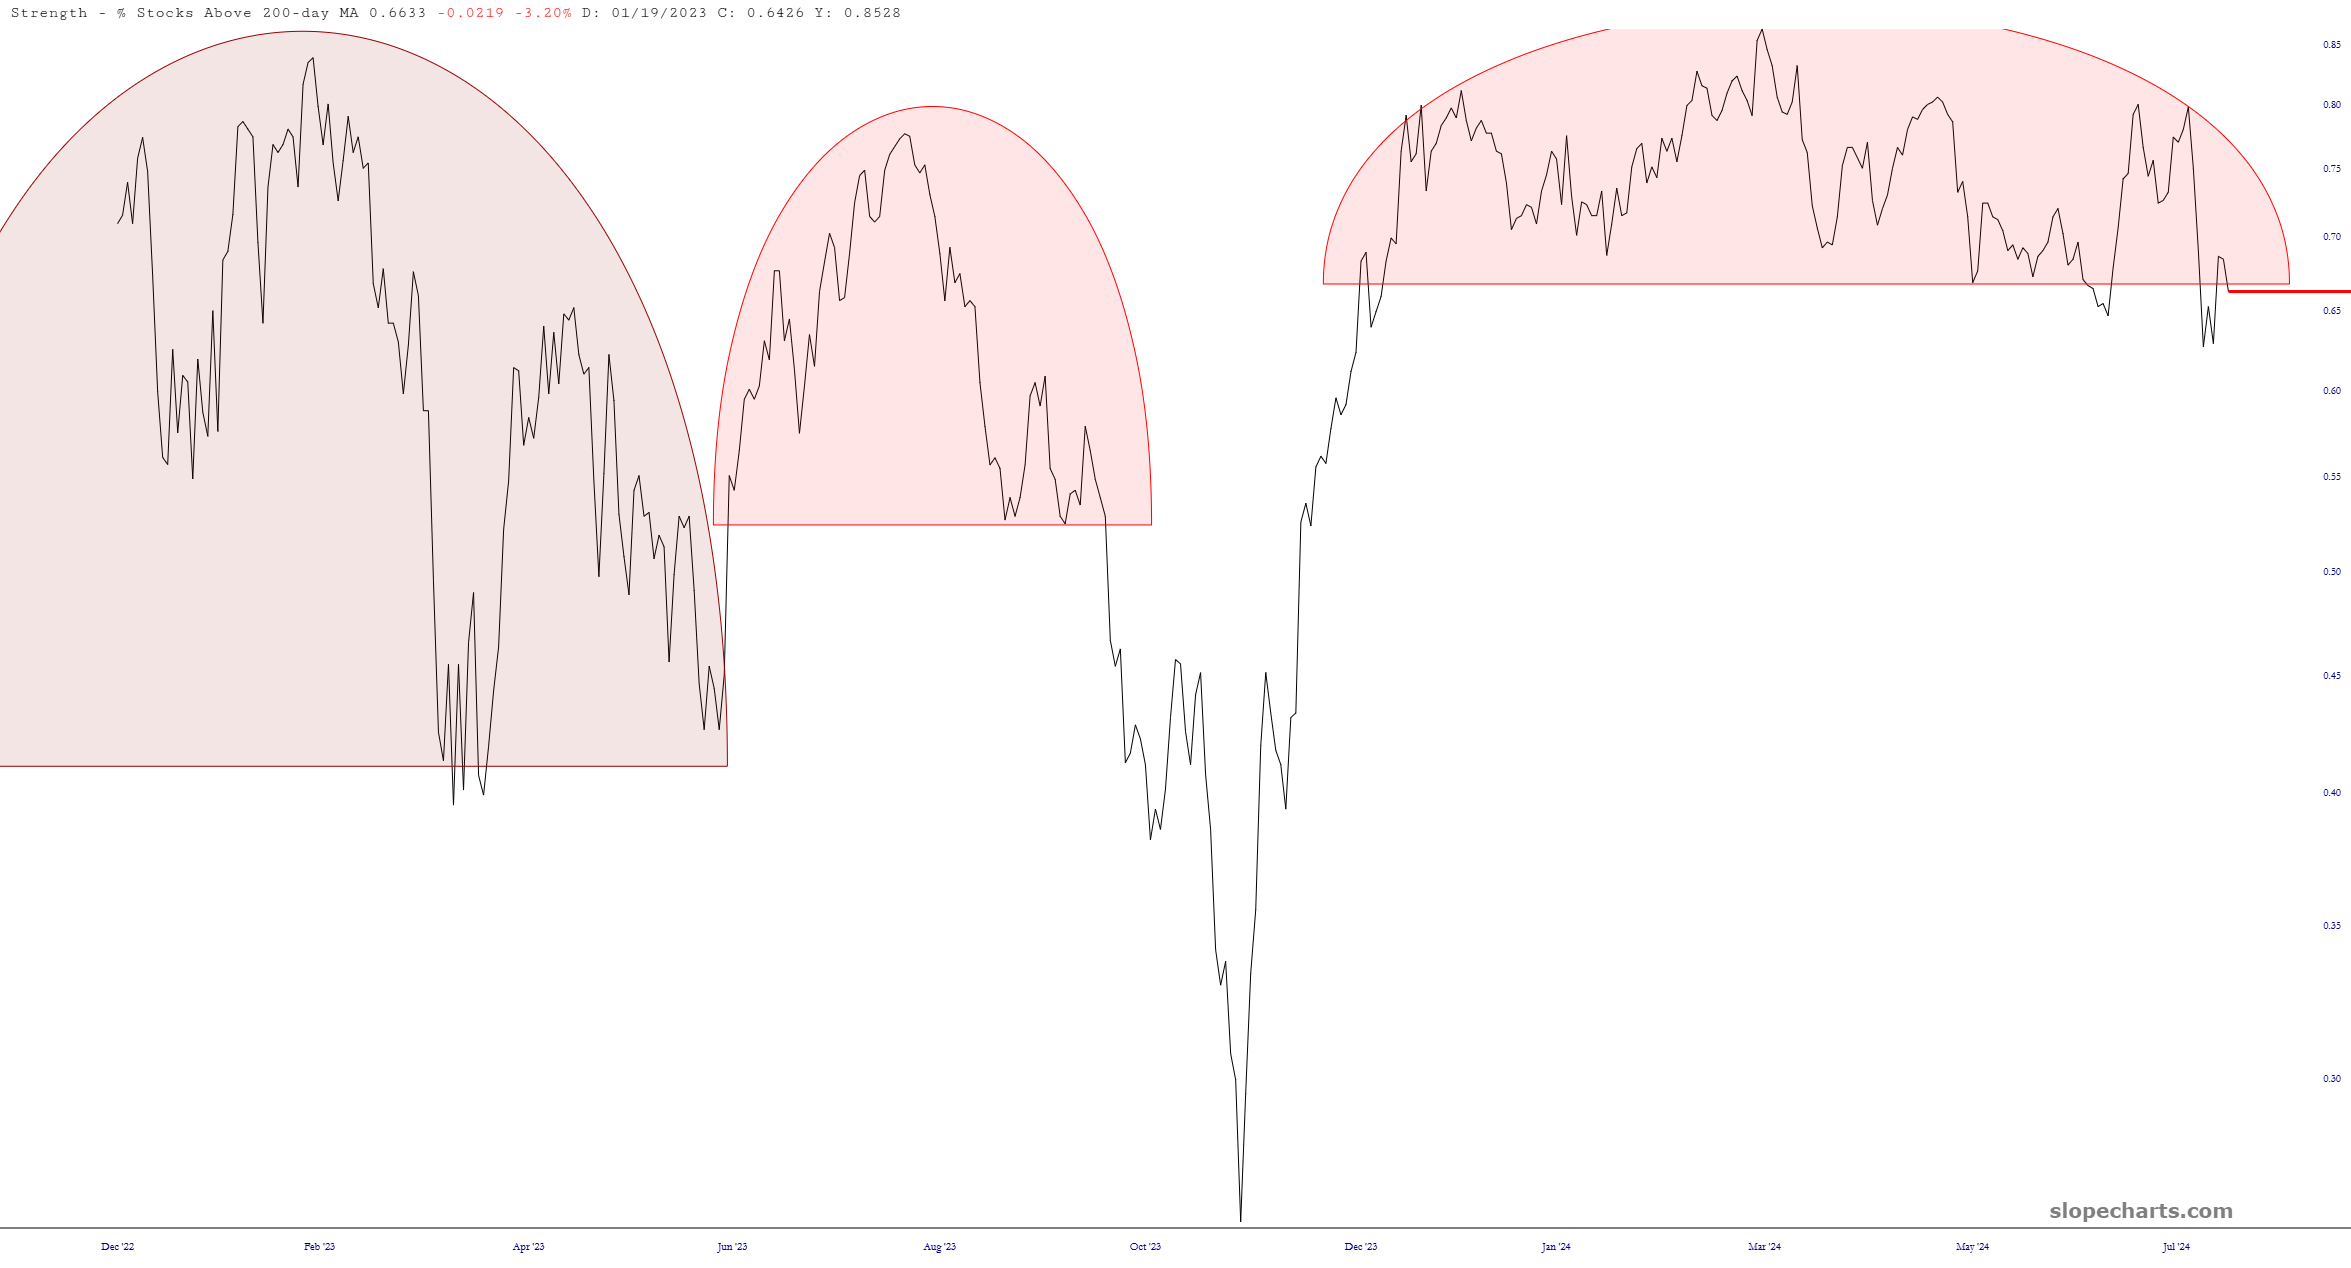
In spite of the recent mega-surge in equities, I’d like to point out that the 80,000 foot view of market strength isn’t looking quite so peachy. Below is the chart of the percentage of stocks above their 200-day moving averages.
More By This Author:
Crocs: A Durable Brand, But A Chart On The BrinkMissed Opportunity: Huntsman’s Plunge And The Puts I Sold Too Soon
DJTriangle
I tilt to the bearish side. Slope of Hope is not, and has never been, a provider of investment advice. So I take absolutely no responsibility for the losses – – or any credit ...
more
How did you like this article? Let us know so we can better customize your reading experience.

Comments
Leave a comment to automatically be entered into
our contest to win a free Echo Show.

