Boeing Elliott Wave View: Impulse Lower Suggest More Downside
Image Source: Unsplash
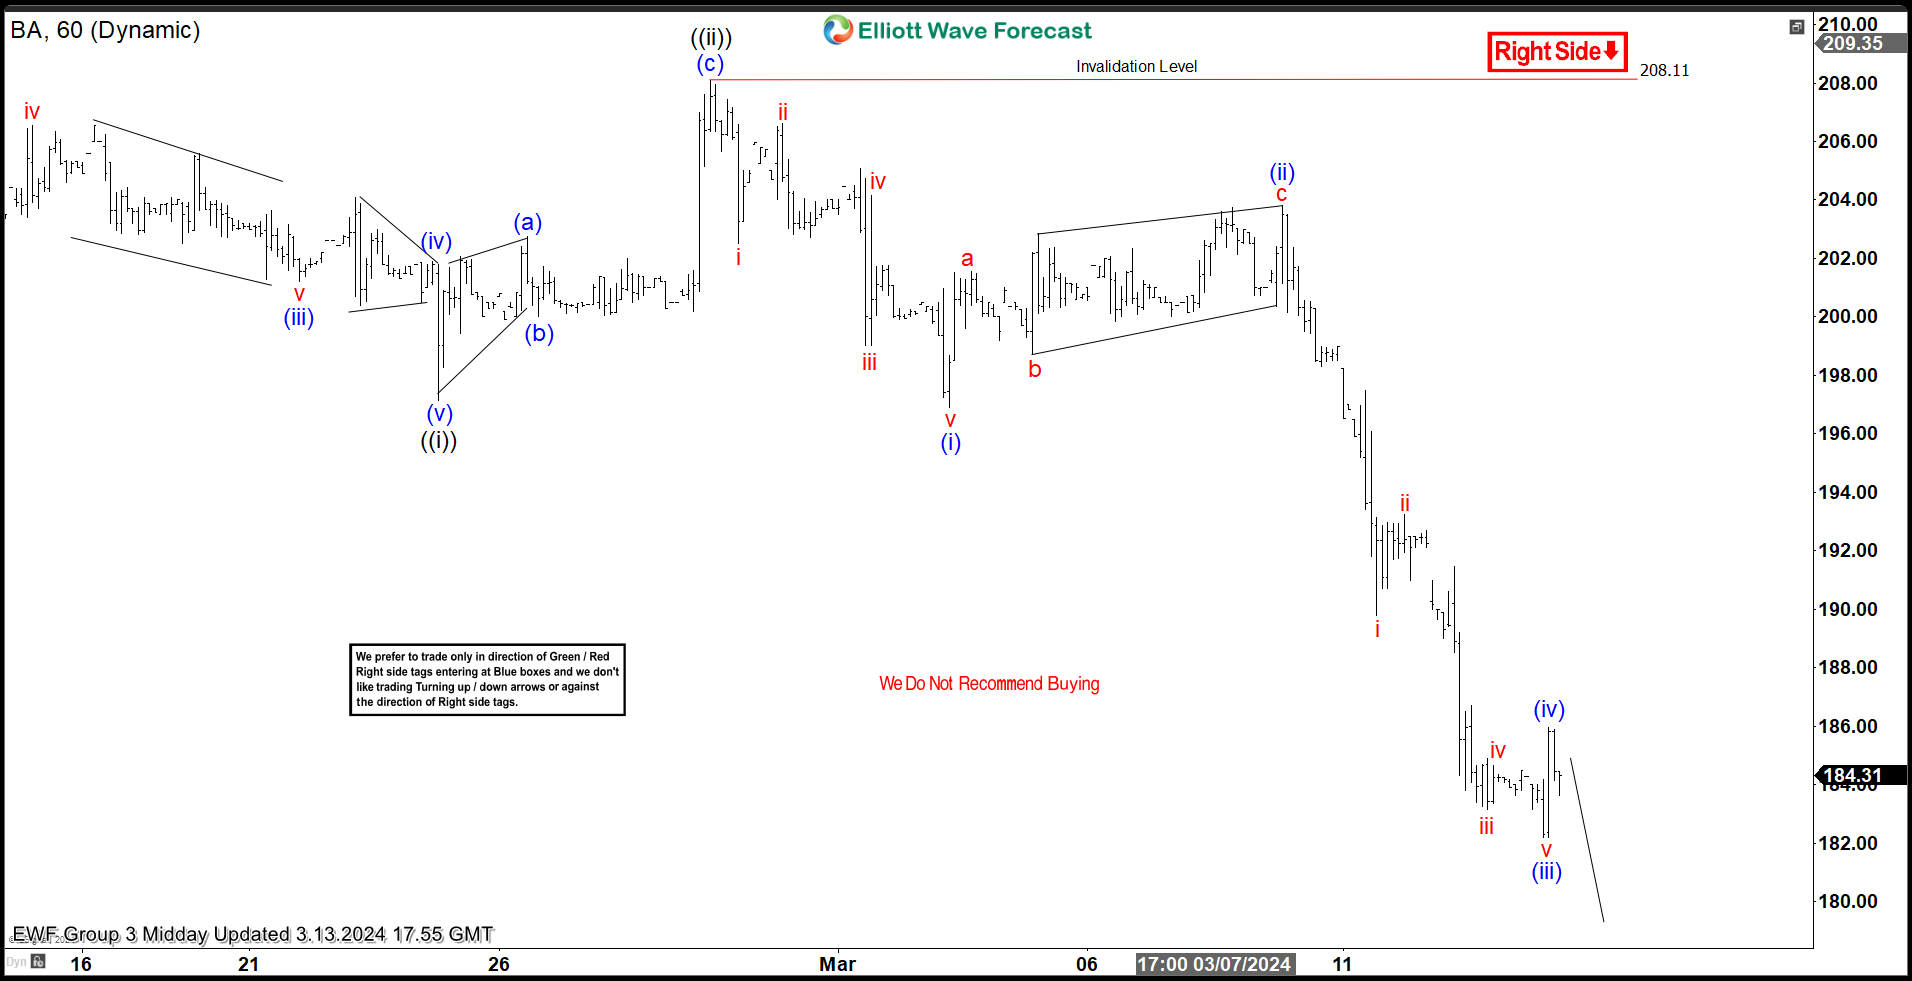
Boeing (BA) ended a corrective cycle in January 24 at 217.59 high and we labeled as wave (B). Then the stock continued lower forming an impulse structure. Down from 24.01.2024 high, wave 1 ended at 198.32 low and bounce in wave 2 finished at 215.03 high. The market resumes lower in wave ((i)) ending at 197.15 low. Pullback in wave ((ii)) higher did a zigzag Elliott Wave structure ending at 208.10 high.
Boeing resumed to the downside in wave ((iii)) that is still in progress. Down from wave ((ii)) in lesser degree, wave i ended at 202.51 and wave ii pullback ended at 206.62. The stock resumes lower in wave iii towards 199.03 and bounce in wave iv ended at 204.15. Last wave v ended at 196.92 which completed wave (i) as a ending diagonal. Rally from 196.92 low ended at 203.80 and also wave (ii) correction. Then, the market drop strongly ended wave (iii) at 182.19 and small bounce to 185.97 end wave (iv) correction. Currently, we are expecting to complete wave (v) and also wave ((iii)) lower where market should react higher in correction as wave ((iv)) before resuming to the downside in wave ((v)) of 3.
Boeing 60 Minutes Elliott Wave Chart
Boeing Elliott Wave Video
Video Length: 00:05:25
More By This Author:
Cisco Pullback Is Not Over Further Downside To ComeGBPJPY Should Resuming To The Upside After A Corrective Pause
Buying The Dips At The Blue Box Area
Disclaimer: Futures, options, and over the counter foreign exchange products may involve substantial risk and may not be suitable for all investors. Leverage can work against you as well as for ...
more


