
BlackRock's Assets Top $10 Trillion On Biggest Quarterly Inflow Since 2015
BlackRock (BLK) burnished its reputation as the world's largest asset manager on Friday when it revealed in its Q4 earnings reports that its assets under management had finally topped $10 trillion, marking a new world record for a publicly-traded asset manager.
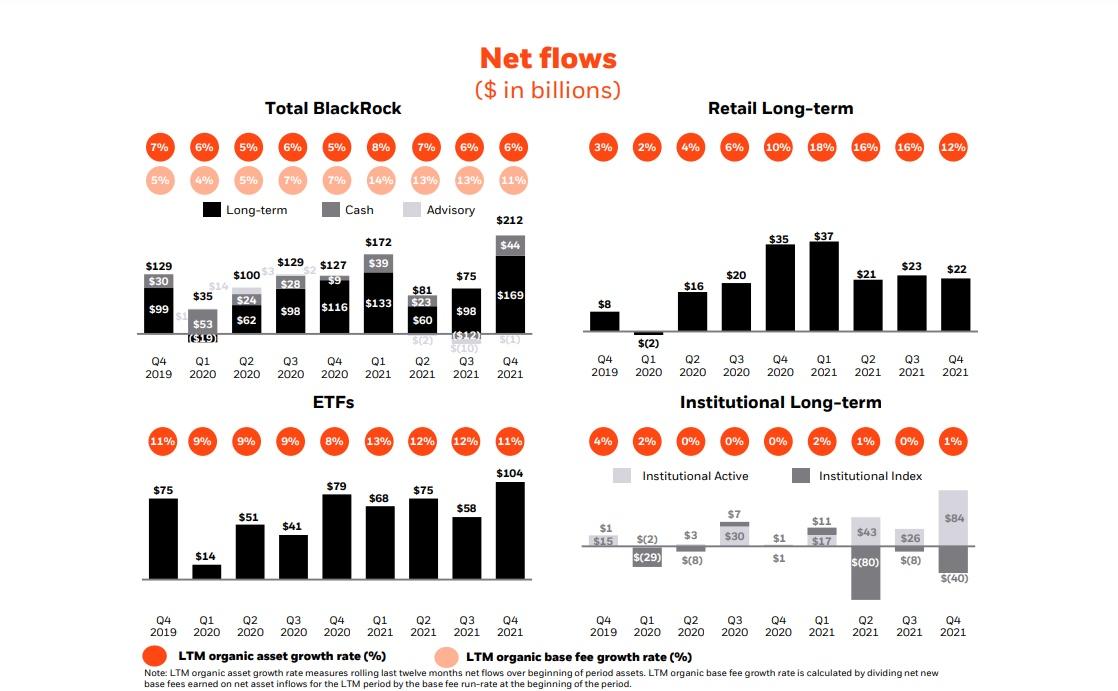
Surging equity valuations helped propel BR's AUM to the $10 trillion mark, as did a net inflow of $104 billion into its ETFs during the three months of the quarter. That's the biggest quarterly inflow since 2015, according to Bloomberg data.

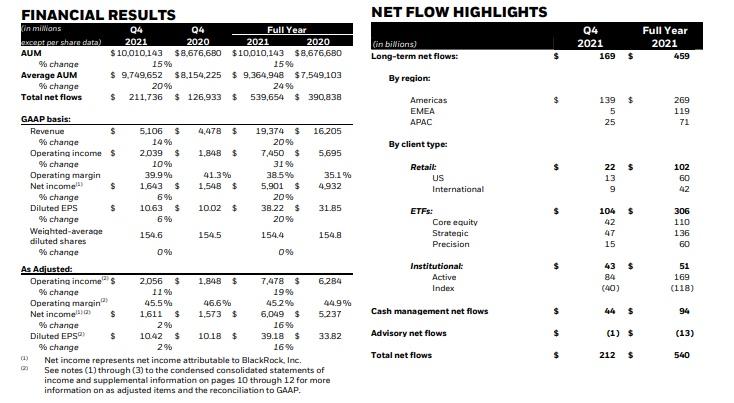
The investing giant beat the Street's expectations for top-line growth by a substantial margin: Q4 net income increased to $1.64 billion or $10.63/share from $1.55 billion or $10.02/share from the year-ago quarter. On average, analysts polled by Reuters expected the company to report earnings of $10.15/share on revenues to $5.17 billion for the quarter.
Excluding one-time items, adjusted net income for Q4 was $1.61 billion or $10.42/share, compared to $1.57 billion or $10.18/share in the prior-year quarter. Meanwhile, total revenue for the quarter increased 14% to $5.11 billion from $4.48 billion in the same quarter last year.
As for what accounted for BlackRock's better-than-expected earnings, the firm saw a net inflow of $212 billion between its cash, long-term investing and advisory businesses. This brought the firm's total full-year net inflow to $540 billion, reflecting 6% organic asset growth and 11% organic base fee growth, led by record inflows to its ETFs and its active investing strategy.
(Click on image to enlarge)
Here's a rundown of BlackRock's earnings and revenue by business segment via Bloomberg:
- Assets under management $10.01 trillion, +15% y/y, estimate $9.85 trillion (Bloomberg Consensus)
- Adjusted EPS $10.42 vs. $10.18 y/y, estimate $10.15 (range $9.750 to $10.70)
- Net inflows $211.74 billion, +67% y/y, estimate $176.63 billion
- Long-term inflows $168.55 billion, +45% y/y, estimate $136.19 billion
- Institutional net inflows $43.09 billion vs. $2.12 billion y/y
- Retail net inflows $21.52 billion, -39% y/y
- Equity net inflows $45.11 billion, -6.2% y/y, estimate $46.48 billion
- Fixed Income net inflows $100.89 billion, +61% y/y, estimate $43.91 billion
- Revenue $5.11 billion, +14% y/y, estimate $5.16 billion (range $5.05 billion to $5.24 billion)
- Investment advisory performance fees $329 million, estimate $426.1 million
- Base fees and securities lending revenue $3.97 billion, estimate $3.99 billion
- Technology services revenue $339 million, estimate $334.2 million
- Operating margin 39.9% vs. 41.3% y/y
- Adjusted operating margin 45.5% vs. 46.6% y/y, estimate 44.2%
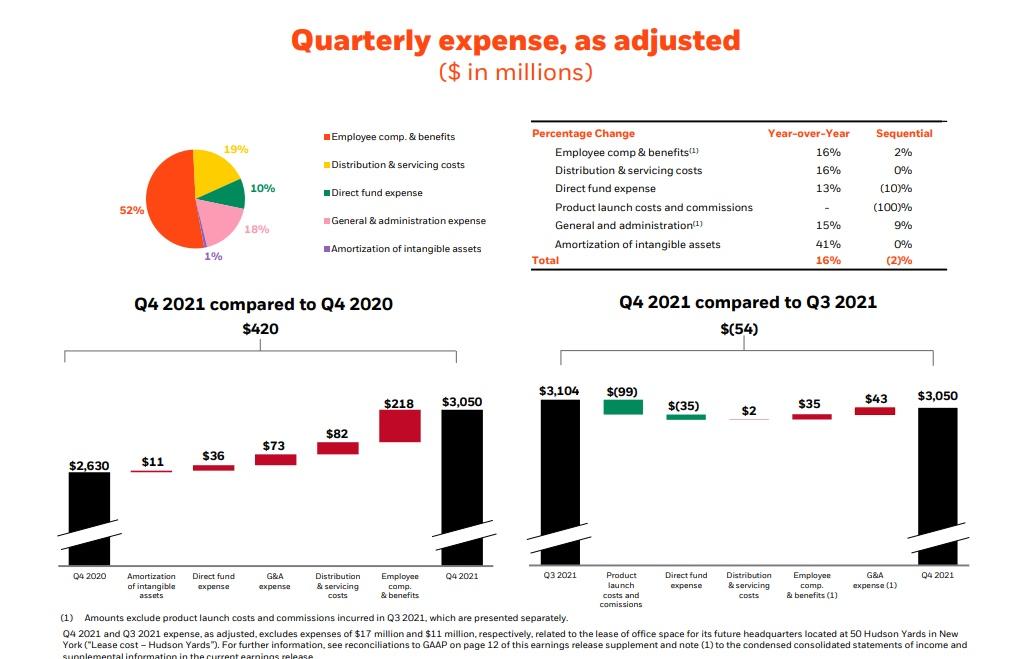
- Total expenses $3.07 billion, estimate $3.15 billion
Here's a breakdown of BlackRock's AUM & financials from the company's press release:
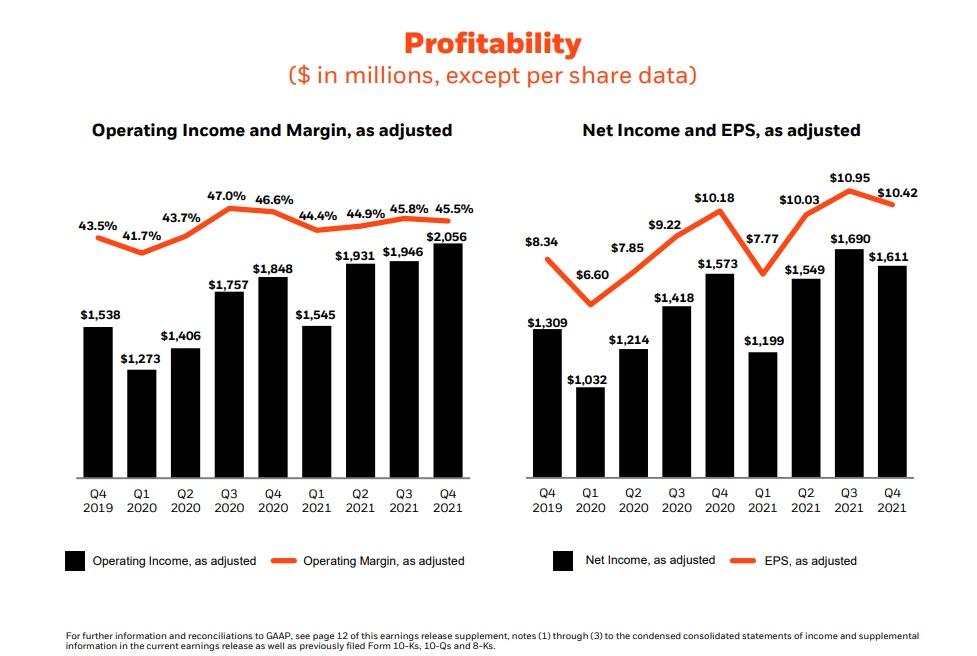
Here are some of the most interesting charts from the firm's quarterly presentation, starting with income & EPS, operating income and margin.
(Click on image to enlarge)
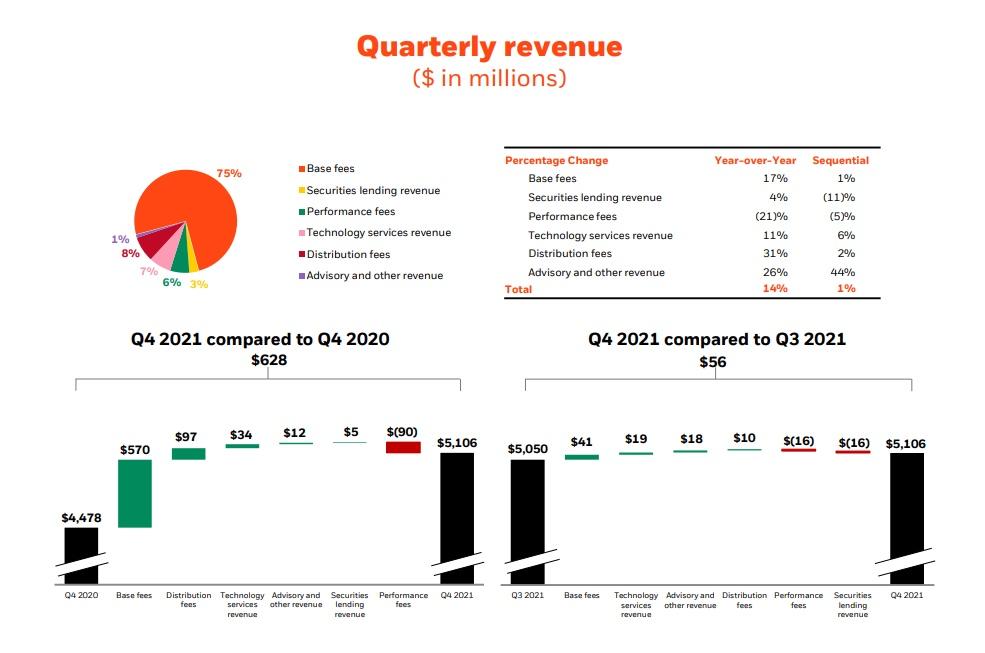
As for BR's revenue, 75% comes from "base fees", the money the firm makes from its ETFs (which are still enormously profitable even as fees continue to decline):
As for its expenses, employee compensation remains by far its largest cost:
Finally, BlackRock's board approved an 18% increase in the quarterly cash dividend to $4.88/share, payable March 23, 2022, to shareholders of record at the close of business on March 7, 2022.
Disclaimer: Copyright ©2009-2022 ZeroHedge.com/ABC Media, LTD; All Rights Reserved. Zero Hedge is intended for Mature Audiences. Familiarize yourself with our legal and use policies ...
more

