Bitcoin Miner CleanSpark Heading Towards An Acceleration

Image Source: Pixabay
CleanSpark, Inc. is a Bitcoin mining company. The company designs its infrastructure and data centers to support Bitcoin, which is a digital commodity and a tool for financial independence. CleanSpark serves clients in the United States. Founded in 2014 and headquartered in Henderson, Nevada, US, one can trade it under the ticker CLSK.
Currently, we can see that Bitcoin and some other cryptocurrencies have been turning towards another bullish cycle higher. The rally in prices should push higher, and it may even provide a magnifying effect on the share prices of cryptocurrency mining/producing companies. Therefore, CleanSpark, being one such company, may become a profitable investment target, as it should ramp up along with the acceleration in Bitcoin prices.
CleanSpark Weekly Analysis - Nov. 26, 2023
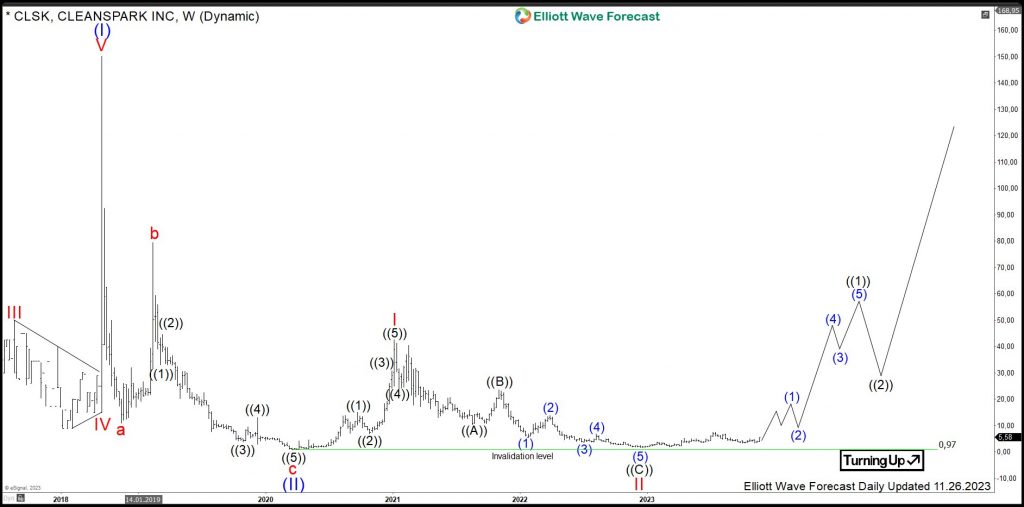
The weekly chart below shows the recent movement in CleanSpark shares. From the all-time lows, the stock price has developed a cycle higher, as shown in blue wave (I). The stock printed its all-time highs in September 2018 at $150.10.
From those highs, a correction lower in wave (II) has unfolded as a zig-zag pattern, taking on a 5-3-5 structure. It found an important bottom in March 2020 at $0.97. In 18 months, the stock lost more than 99% off its peak value.
From the March 2020 lows, another cycle had started before ending in December 2022. Now, acceleration higher in red wave III should take place. In the medium-term, the target will be within the 43.11-68.11 area, and perhaps even higher. Later, I expect red waves IV and V to follow. In the long run, the target is the 151-244 area and beyond.

CleanSpark Daily Analysis - Nov. 26, 2023
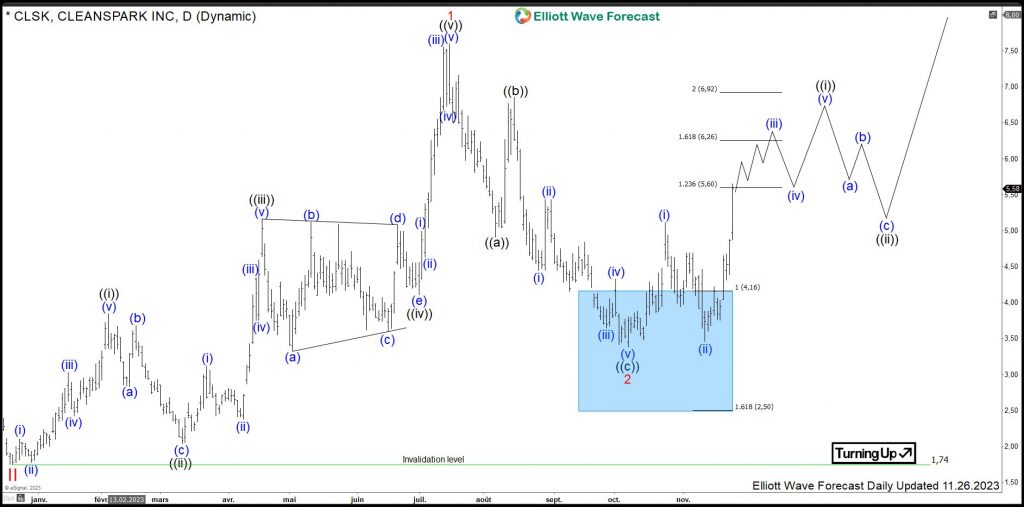
The daily chart below shows the initial stages of red wave III in more detail. From the December 2022 lows, a bullish cycle, as shown in red wave 1, has unfolded. The wave ((v)), displayed in black, shows an extension. The pattern in red wave 1 ended in July 2023 at $7.60. From the highs, the consolidation pattern in red wave 2 has unfolded as a zig-zag pattern.
The 5-wave pattern, as shown by black ((a)), found a bottom in August 2023 at $4.91. Then, a bounce, as shown in black wave ((b)), hit the $6.86 level. From there, black wave ((c)) broke below the August 2023 lows, opening up a bearish sequence. The target within the 4.16-2.50 area was reached as the price was seen bouncing.
It appears that the pattern seen in red wave 2 ended in October 2023. With the price still above the $3.38 mark, the next bullish cycle, as shown in red wave 3, looks to have started. The short-term target will be within the 9.25-12.88 area, and perhaps even higher. For the long-term perspective, recent prices below $6 may offer a great investment opportunity.

More By This Author:
Bank Of America Bearish Sequence Provides Floor For Indices
Silver Preparing For Breakout Higher
Oil Short Term Impulsive Structure Suggests Further Upside
Disclaimer: Futures, options, and over the counter foreign exchange products may involve substantial risk and may not be suitable for all investors. Leverage can work against you as well as for ...
more


