
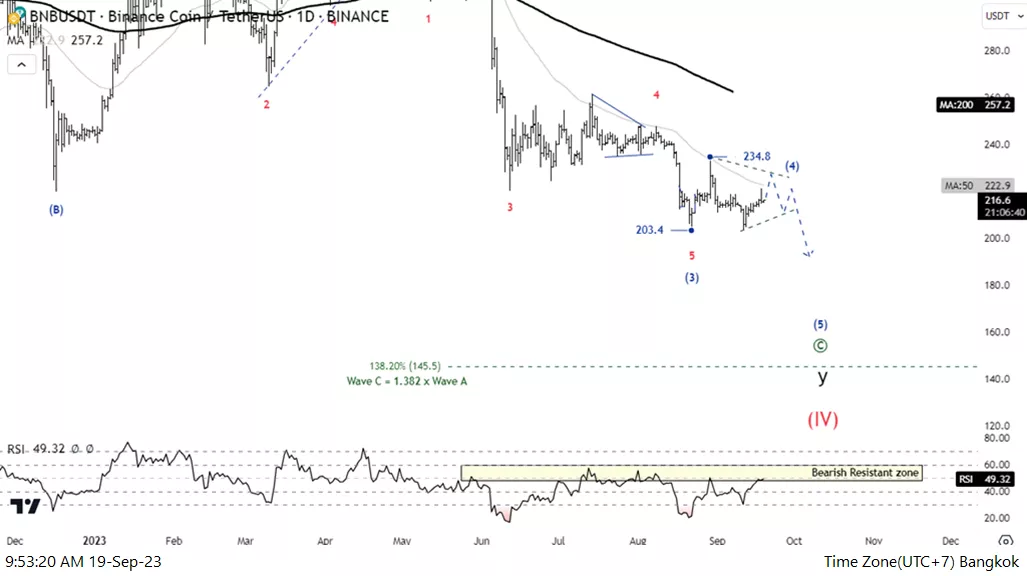
Elliott Wave Analysis TradingLounge Daily Chart, 19 September 23,
Binance/U.S. dollar (BNB-X)
BNBUSD Elliott Wave Technical Analysis
Function: Follow Trend
Mode: Motive
Structure: Impulse
Position: Wave (5)
Direction Next higher Degrees: wave ((C)) of Zigzag
Wave Cancel invalid level:
Details: Wave ((C)) trend move to 138.2% of Wave ((A)) at 23214.83
Binance/U.S. dollar (BNBUSD)Trading Strategy: the overview downtrend of Binance does not end, by the price still below MA200, MA50 Line and Wave ((C)) is not complete, we look for the price at below 203.4
Binance/U.S. dollar (BNBUSD)Technical Indicators: The price is a below the MA200 indicating a downtrend, RSI is a Bullish Momentum.
TradingLounge Analyst: Kittiampon Somboonsod, CEWA
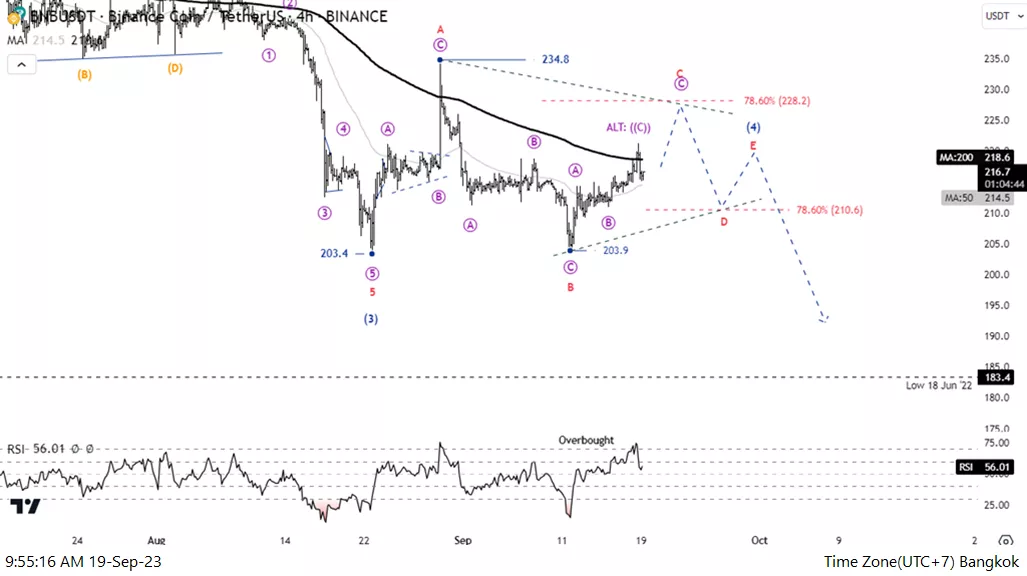
Elliott Wave Analysis TradingLounge 4H Chart, 19 September 23,
Binance/U.S. dollar (BNBUSD)
BNBUSD Elliott Wave Technical Analysis
Function: Counter Trend
Mode: Corrective
Structure: Triangle
Position: Wave 4
Direction Next higher Degrees: wave ((C)) of Zigzag
Wave Cancel invalid level: 234.8
Details: the Movement within a triangle pattern
Binance/U.S. dollar (BNBUSD)Trading Strategy: the overview downtrend of Binance does not end, by the price still below MA200, MA50 Line and Wave ((C)) is not complete, we look for the price at below 203.4
Binance/U.S. dollar (BNBUSD)Technical Indicators: The price is a below the MA200 indicating a downtrend, RSI is a Overbought.
More By This Author:
AAVE/U.S. Dollar(AAVEUSD) Elliott Wave Technical Analysis 18 September 23
Day Chart Elliott Wave Technical Analysis: British Pound, Monday, Sept. 18
4 Hour Chart Elliott Wave Technical Analysis: British Pound, Monday, Sept. 18


Comments
Log in or sign up to join the conversation.