Bank Of America Near Support Area

Image Source: Pexels
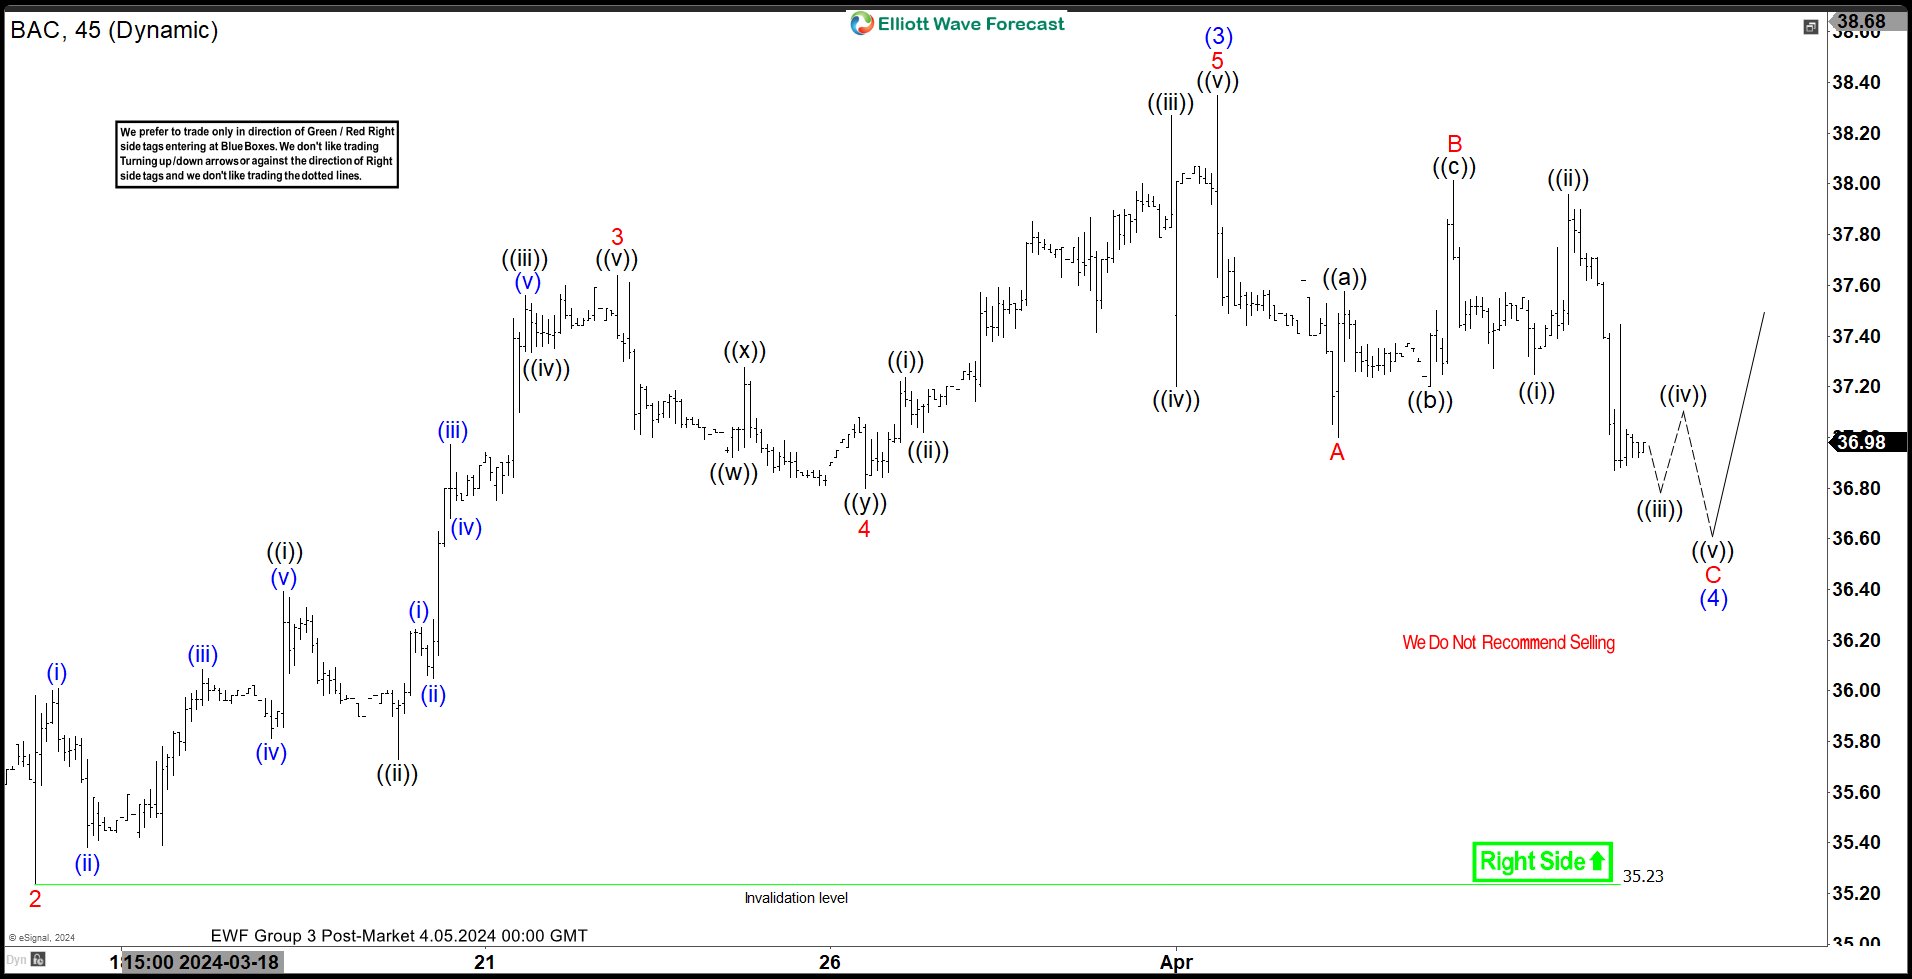
BACUp from there, wave (1) ended at 35.1 and dips in wave (2) ended at 32.35. The stock extends higher again in wave (3). Up from wave (2), wave 1 ended at 36.45 and pullback in wave 2 ended at 35.24. The stock extended higher again in wave 3 towards 37.64 and pullback in wave 4 ended at 36.8. Final leg wave 5 ended at 38.35 which completed wave (3).
The stock is now pulling back in wave (4) with internal subdivision as a zigzag structure. Down from wave (3), wave A ended at 37 and rally in wave B ended at 38.02. Wave C lower is in progress and can see further downside as a 5 waves. Down from wave B, wave ((i)) ended at 37.25 and wave ((ii)) ended at 37.96. Wave C target can reach 100% – 161.8% Fibonacci extension of wave A. This area comes at 35.85 -36.68. From this area, the stock can see buyers for further upside or 3 waves rally at least.
BAC 45 Minutes Elliott Wave Chart
BAC Elliott Wave Video
Video Length: 00:02:40
More By This Author:
Gold Miners ETF Extending Higher In Impulsive StructureNifty Pullback Should Continue To Find Buyers
EURJPY : Setting Up For A Move Higher?
Disclaimer: Futures, options, and over the counter foreign exchange products may involve substantial risk and may not be suitable for all investors. Leverage can work against you as well as for ...
more


